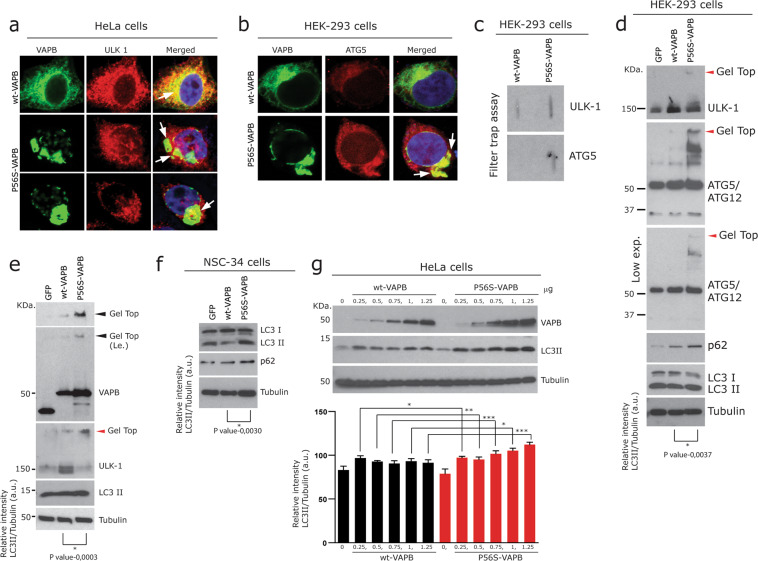
Fig. 3. P56S-VAPB alters early steps of autophagy.
a Co-labelling of wt-VAPB and P56S-VAPB transfected HeLa cells with ULK1 showing co-localisation with wt-VAPB. Note the reduction as well as the sequestration of ULK1 (arrows; merged middle and lower images) with P56S-VAPB aggregates. Scale bar: 10 µm. b Sequestration of ATG5-ATG12 (arrows) with P56S-VAPB aggregates in HEK-293 cells Scale bar: 10 µm. c Filter trap assay of the above transfected cells, showing SDS resistant aggregates of ULK1 and ATG5-ATG12 in P56S-VAPB expressing cells. d, e Immunoblot analysis showing gel top aggregation (red arrowheads) as well as reduced soluble levels of ULK1 together with increased levels of LC3-II in P56S-VAPB overexpressing HEK-293 cells (d) and in HeLa cells (e). Note the gel top aggregation (red arrowheads) of ATG5-ATG12 complex in P56S-VAPB overexpressing cells as well as increased levels of ULK1 in wt-VAPB overexpressing cells. Unpaired Student’s t test for comparison between two sample groups Values were expressed as mean ± standard error of mean (SEM) from three independent experiments. The asterisks denote significant differences (*p < 0.05, ***p < 0.001). f Immunoblot analysis of NSC-34 cells showing increased levels of LC3-II and p62 in P56S-VAPB expressing NSC-34 motor neuron-like cells. Unpaired Student’s t test for comparison between two sample groups Values were expressed as mean ± standard error of mean (SEM) from three independent experiments. The asterisks denote significant differences (*p < 0.05). g Immunoblot analysis (quantification below) showing concentration dependent increased levels of LC3-II and p62 in P56S-VAPB overexpressing cells compared to the wt-VAPB expressing HeLa cells. Graph pad prism, One-way ANOVA, values were expressed as mean ± standard error of mean (SEM) from three independent experiments. The asterisks denote significant differences (*p < 0.05, ***p < 0.001).

