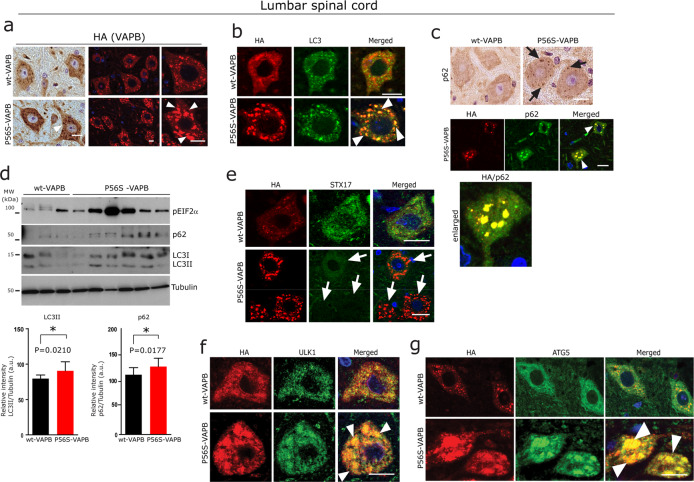
Fig. 4. Autophagy defects in P56S-VAPB transgenic mice.
a Representative DAB immunohistochemistry (Left panel) and immunofluorescence staining (right panel) using HA antibody in lumbar spinal cord α-MNs of wt and P56S-VAPB tg mice, showing globular aggregates in the α-MNs (arrowheads) of P56S-VAPB tg mice. Scale bars: 15 µm. b, c Double immunofluorescence labelling for HA and for the autophagy marker LC3 (b) and p62 lower panel showing co-localisation (arrowheads) with P56S-VAPB aggregates (c), and DAB immunohistochemistry showing globular accumulations of p62 (arrows, upper panel) (c) in lumbar spinal cord α-MNs, Scale bars: 15 µm. d Immunoblot analysis of lumbar spinal cord homogenates from P56S-VAPB (n = 6, male, 200 days) and their age-matched wt-VAPB mice (n = 3, male, 201 days), showing an overall increased level of ER stress markers pIF2α and autophagy markers p62 and LC3 in P56S-VAPB tg mice. Corresponding densitometric data are shown at the bottom; representing the average relative band intensity from n = 3 wt-VAPB and n = 6 P56S-VAPB of p62, LC3-II/LC3-I normalised with tubulin levels. Unpaired Student’s t test for comparison between these two sample groups (average, n = 3 wt-VAPB mice and average, n = 6 P56S-VAPB mice) Values were expressed as mean ± standard error of mean (SEM) from three independent blots. The asterisks (*) denote significant differences (*p < 0.05). e–g Double immunofluorescence labelling for HA and for the SNARE protein STX17 (e), early autophagy proteins ULK1 (f) and ATG5-ATG12 (g) showing their co-localisation (arrowheads) with P56S-VAPB aggregates in lumbar spinal cord α-MNs. Note the loss of STX17 immunoreactivity (arrows in e) in α-MNs harbouring P56S-VAPB aggregates in lumbar spinal cord of P56S-VAPB mice. Scale bars: 15 µm.

