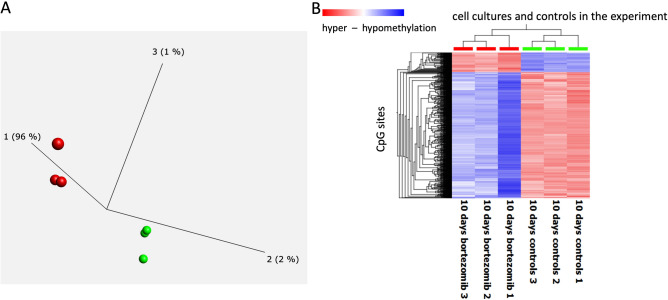
Figure 2.
PCA (Principle Component Analyses)—(A) and heatmap—(B), illustrating results of genome wide methylation changes in cells under treatment and controls. PCA indicates three replicates of genome wide methylation profiles of cells recovered after BTZ treatment after 10 days (red color) have significantly different methylation profile than controls (green color). Heatmap illustrating unsupervised clustering analyses of methylation changes at the most informative CpG sites in the data set verifies PCA analyses with cells recovered after BTZ treatment (red color top of chart) displaying significant hypomethylation (blue color in the heatmap) and a degree of hypermethylation (red color in the heatmap) in comparison to controls (green, top of chart).

