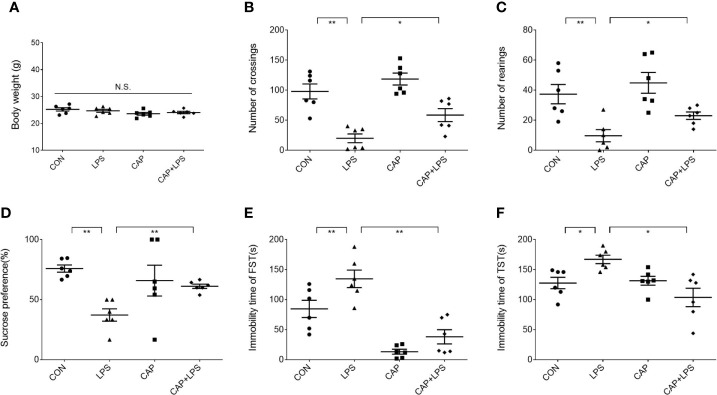
Figure 2.
Effects of dietary CAP on body weight and depression-like behavior in LPS-treated mice. (A) Body weight (F3,20 = 1.771, P > 0.05). (B) Number of crossings in open field test (F3,20 = 17.99, P < 0.01). (C) Number of rearings in open field test (F3,20 = 8.728, P < 0.01). (D) Sucrose preference of sucrose preference test (F3,20 = 5.296, P < 0.01). (E) Immobility time of forced swimming test (F3,20 = 20.05, P < 0.01). (F) Immobility time of tail suspension test (F3,20 = 6.411, P < 0.01). Results are represented as mean ± SEM (n = 6). Asterisk has been used for significant differences (*P < 0.05, **P < 0.01, N.S., not significant).

