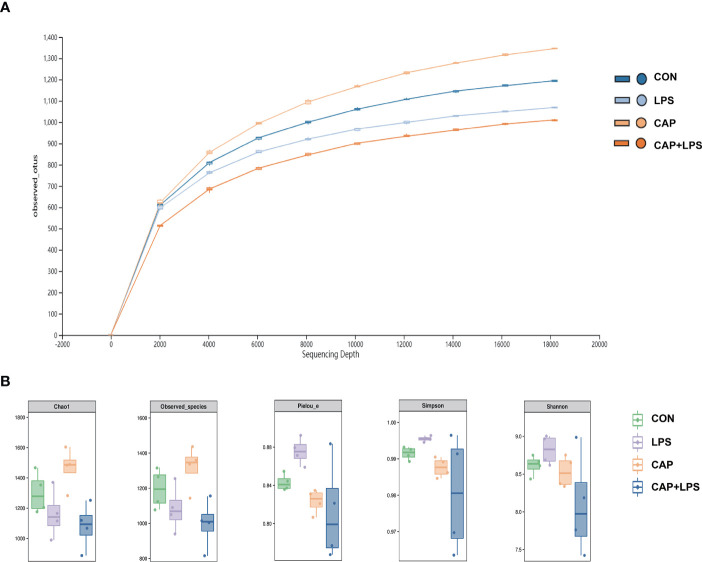
Figure 4.
(A) The rarefaction curve to assess the sequencing depth in every group (n = 4); (B) Chao1 estimator, Observed species, Pielou’s index, Simpson index, Shannon index (n = 4). Data are presented as box and whisker plots. The box denotes the interquartile range (IQR, 75th to 25th percentiles of the data), and the mean value is represented by a straight line within the box; whiskers extend to 1.5 × IQR, or the most extreme value. The Kruskal-Wallis test was used to conduct one-way ANOVA on the results. And there were no significant differences among CON, LPS and CAP+LPS groups.

