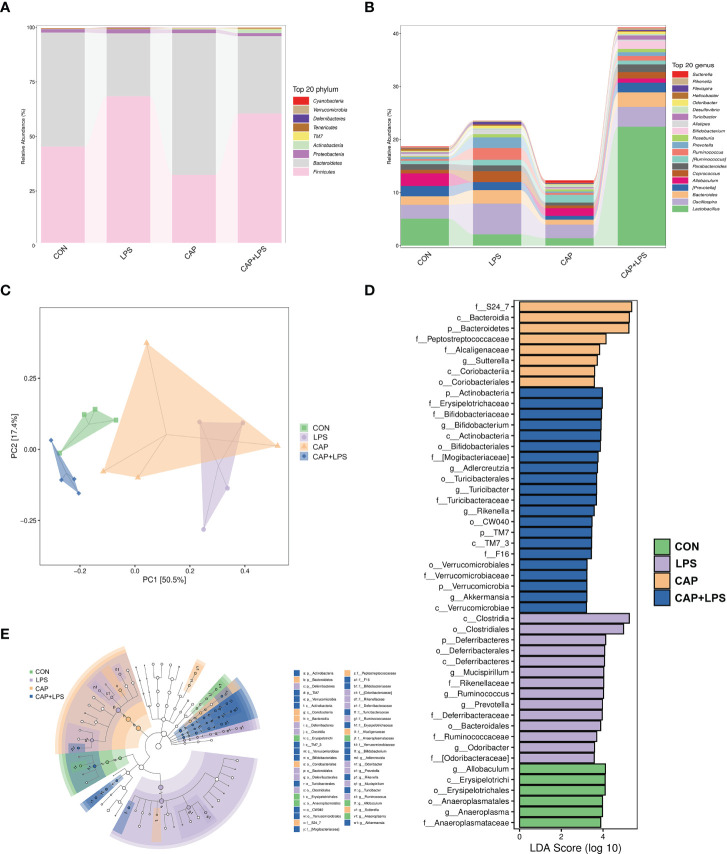
Figure 7.
(A) The community structures of different microbes at the phylum level in the four groups, colors indicate distinct microbe of phylum (n = 4); (B) The microbiota structures at the genus level in the four groups, different colors denote distinct microbe of genus (n = 4); (C) Orthogonal partial least squares discriminant analysis (OPLS-DA) of the microbiota in all groups (n = 4); (D) Linear discriminant analysis effect size (LEfSe) 10 was set up with 0.05 as the alpha value for Kruskal-Wallis and Wilcoxon test and then selected OTUs with LDA scores above 3 (n = 4); (E) LDA scores greater than 3 when comparing all groups, as described above (n = 4).

