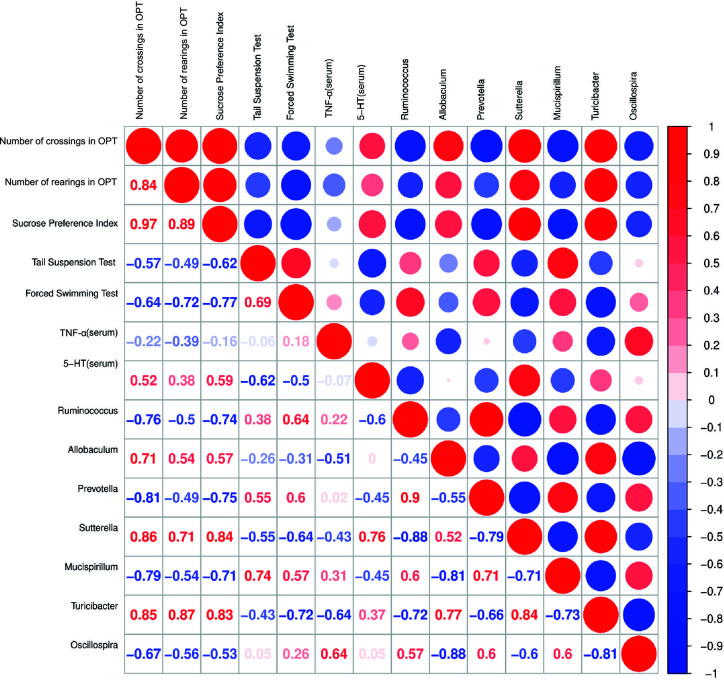
Figure 9.
Correlation analysis between behavioral results, serum 5-HT, TNF-α levels and abundance of signature gut microbiota. Spearman’s correlation analysis was performed by data of the LPS group and CAP+LPS group (n = 8). In the upper right corner, the color and size of the circle denote the strength of correlation, red is positive, and blue is negative. The corresponding correlation numeric data could be found in the lower left corner.

