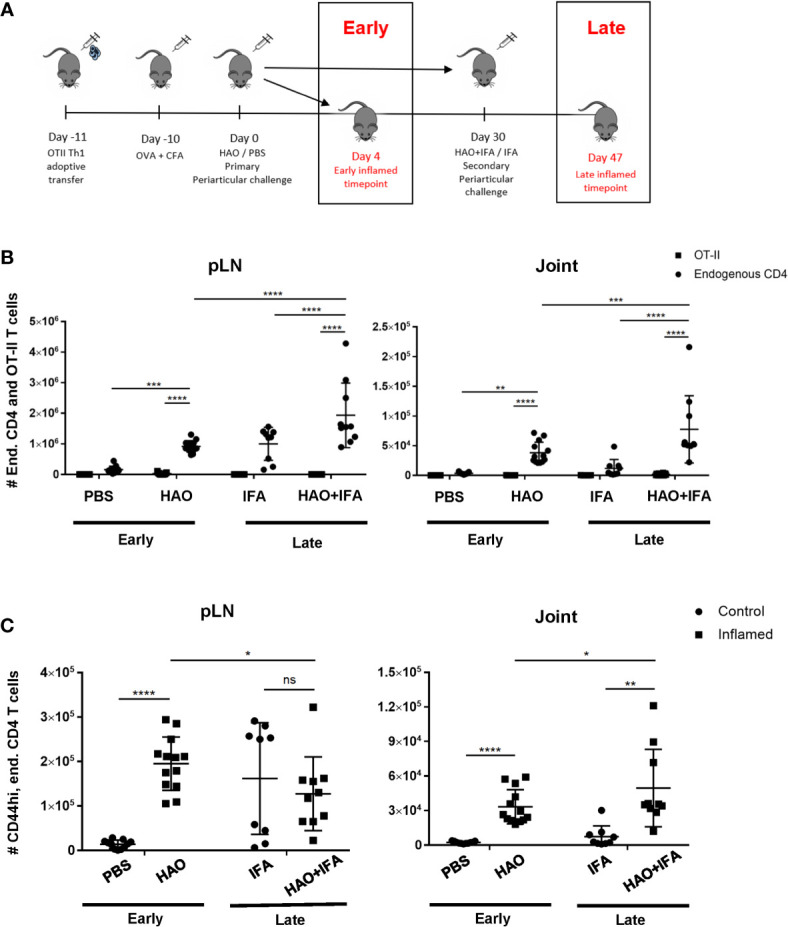
Figure 1.

Outline of model phases and number of endogenous, OT-II, and endogenous antigen experienced CD4 T cells at both phases. (A) Illustration of early and late phases of inflammatory arthritis. (B) Number of endogenous CD4 T cells (CD4+, CD45+, CD45.1-) and OT-II T cells (CD4+, CD45+, CD45.1+) from pLNs and joints of mice undergoing inflammatory arthritis at the early and late phases and respective controls. (C) Number of antigen experienced endogenous CD4 T cells (CD4+, CD45+, CD45.1-, CD44hi) from pLNs and joints of mice undergoing inflammatory arthritis at the early and late phases and respective controls. Data is representative of mean ± SD with each point representing individual experimental mice. Data represents three independent experiments for the early phase and two independent experiments for the late phase with n=5 for each experiment. Groups were compared using 2-way ANOVA and Student’s t-tests. Stars represent the following p-values: *<0.05, **<0.01; ***<0.001; ****<0.0001; ns, not significant. HAO, heat-aggregated OVA; IFA, incomplete Freund’s adjuvant.
