Figure 3.
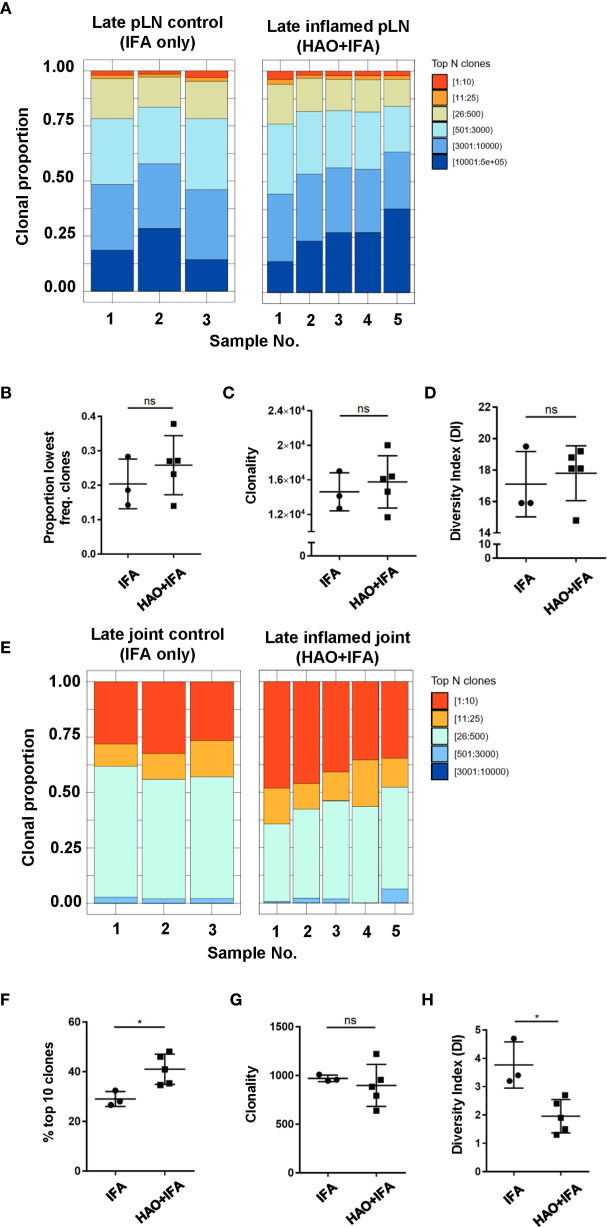
Characterisation of antigen experienced endogenous CD4 T cell repertoires from inflamed pLNs and joints and IFA controls at the late phase. Proportion of the top 10 most frequently occurring clones, followed by the next 25, 500, 3000, 10,000, and 100,000 most frequent clones contributing to the endogenous antigen experienced CD4+ T cell repertoire in (A) inflamed pLNs, and (E) inflamed joints at the late phase (HAO+IFA) and IFA only controls. (B) Proportion of the least frequently occurring clones in inflamed pLNs at the late phase and IFA controls. (F) Percentage contribution of the top 10 most frequently occurring clones in inflamed joints at the late phase and IFA controls. (C, G) clonality, represented as the number of unique CDR3β DNA sequences, in (C) inflamed pLNs and IFA controls, and (G) inflamed joints and IFA controls at the late phase. (D, H) diversity indices of (D) inflamed pLNs and IFA controls, and (H) inflamed joints and IFA controls at the late phase. Data is representative of mean ± SD with each point representing individual experimental mice. Data represents 1 experiment with n=5 for the inflamed group and n=3 for the control group. Groups were compared using unpaired Student’s t-test. Stars represent the following p values: *<0.05; ns, not significant.

