Figure 5.
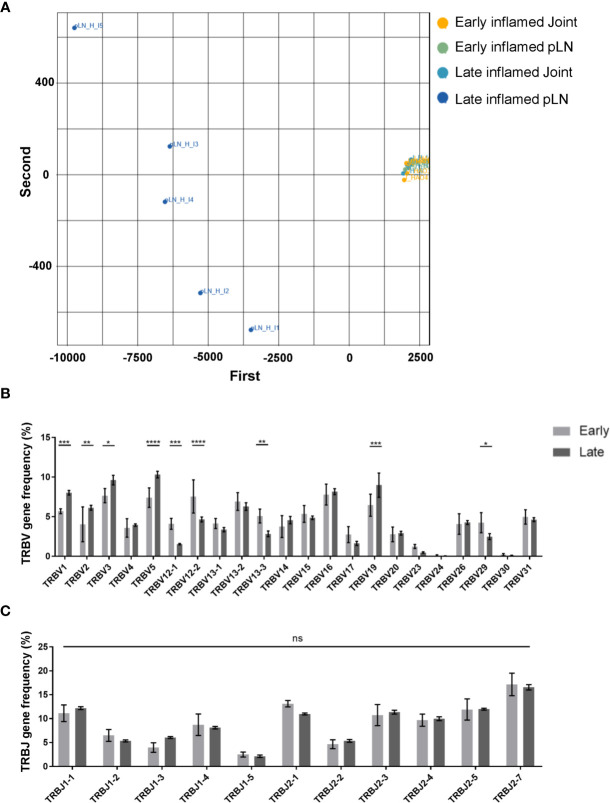
Range of TRBV genes expressed in antigen experienced endogenous CD4 T cell repertoires of inflamed pLNs and joints at the early and late phases. (A) PCA plot of TRBV gene frequency in repertoires of inflamed pLNs and joints at the early and late phases. Frequency of (B) TRBV gene expression, and (C) TRBJ gene expression in inflamed pLNs at the early and late phases. Graphs represent 1 experiment with n=5 for both the early and late inflamed groups. Groups were compared using ordinary 2-way ANOVA with Sidak’s multiple comparisons test. Data presented as mean ± SD. Stars represent the following p values: *<0.05; **<0.01; ***<0.001; ****<0.0001; ns, not significant.

