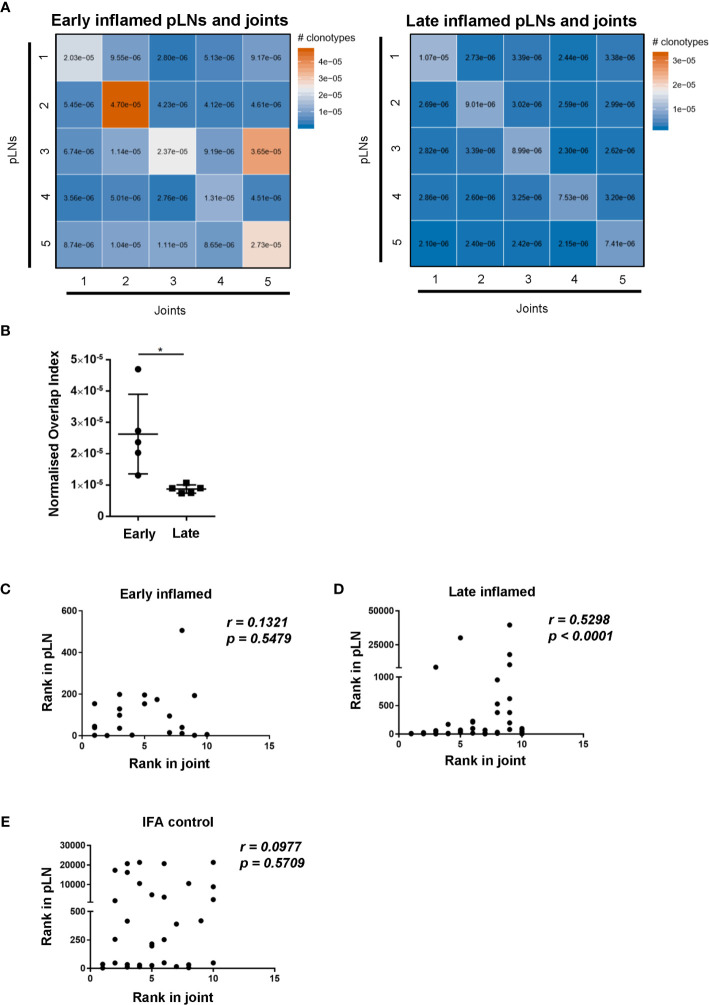
Figure 6.
Degree of CDR3β amino acid sequence overlap and correlation of most abundant clones between inflamed pLNs and joints at the early and late phases. (A) Heatmaps of normalised number of CDR3β amino acid sequences (see methods) between inflamed pLNs and joints at the early (left) and late (right) phases. (B) Graph representing the intersects (diagonal) of (A) representing CDR3β sequence overlap between inflamed pLNs and joint within the same animal. (C–E) Correlation of the top 10 ranked clones in joints with their rank in respective pLN samples. The rank of each of the top 10 clones in (C) inflamed joint at the early phase, (D) inflamed joint at the late phase, and (E) IFA control joint samples were plotted against the rank of that clone in respective pLN samples. Data is representative of one experiment with n=5 for the early and late phase inflamed groups and n=3 for controls. Graph in (B) is representative of mean ± SD with each point representing individual experimental mice. * represents p<0.05. In C-E correlations (r) were calculated using Spearman’s correlation after testing for normality of the data using the D’Agostino-Pearson test. p represents the p value.

