Figure 8.
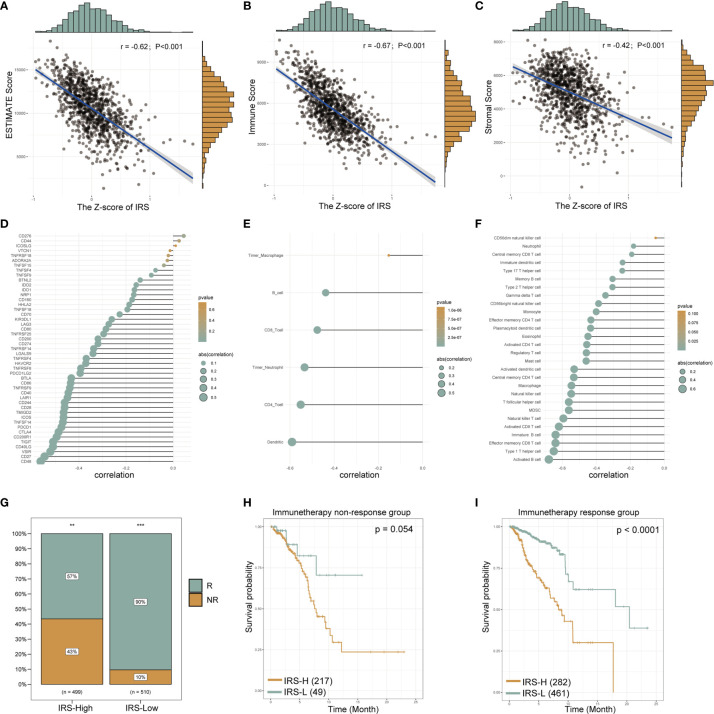
The gene signature serves as a valuable marker for immune targets and immunotherapy response. The estimated scores, immune scores and stromal scores of breast cancer from TCGA database were analyzed by the “estimate” R package. The correlation line chart shows the relationship between the Z-score of the IRS and the estimated score (A), immune score (B) and stromal score (C) (r values and p-values are shown; a larger slope of the line in the graph means a higher correlation) (details see methods section). The correlation bubble chart shows the association between the Z-score of the IRS and immune checkpoint genes (D), the 6 immune infiltration cell scores from TIMER (E) and 28 immune infiltration cell scores from TCIA (F) (see the Methods section for data acquisition). The size of the bubble represents the value of the correlation, and the shade of the color represents the value of the p-value. Proportion of immune-responsive and nonimmune-responsive populations in the IRS high- and low-expression groups (G). Survival analysis graph showing differences in survival between IRS-high and IRS-low groups in nonimmune-responsive (H) and immune-responsive (I) populations. IRS, immune-related risk score; High-IRS, high immune-related risk score; Low-IRS, low immune-related risk score. **means p <0.01, ***means p<0.001.

