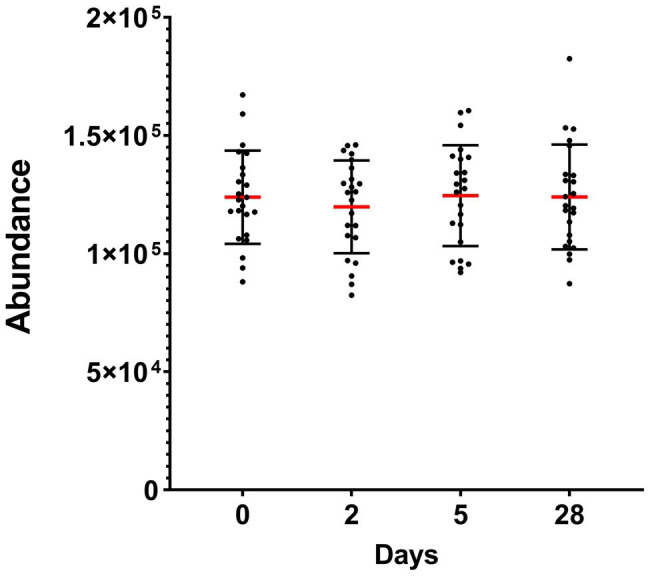
Figure 3.

Total abundance of the oral bacterial communities in saliva from commercial saturation divers (n = 23) before, during, and after 28 days of heliox saturation, displayed as the number of reads for all detected OTU after 16S sequencing. For each time-point, means (red line) and individual values are shown. Error bars are ±1 SD. Day 0, before saturation; days 2 and 5, during the bottom phase; day 28, after decompression.
