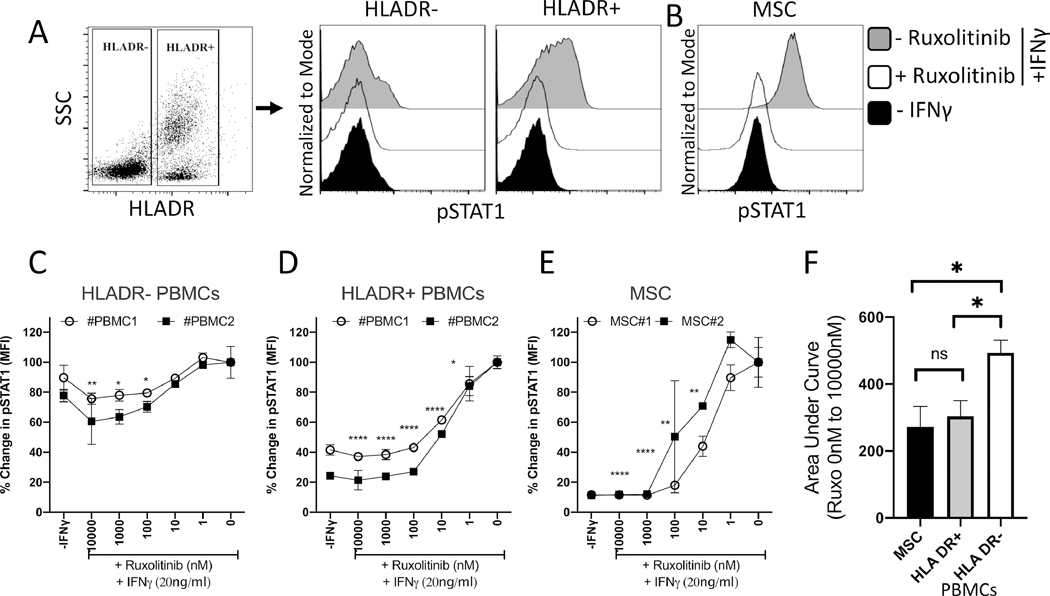
Figure 6. Relative inhibition STAT-1 phosphorylation on MSCs and HLADR+ populations of PBMCs.
PBMCs and MSCs were stimulated with IFNγ in the presence of varying concentrations of Ruxolitinib. Phosflow analysis was performed on PBMCs and MSCs for pSTAT1 expression. PBMCs were additionally stained for phosflow compatible HLADR antibody. (A) Gating strategy for PBMCs based on Side scatter and HLADR expression is shown. Representative histogram is shown for pSTAT1 expression in (A) HLADR+ and HLADR- populations and (B) bone marrow MSCs. Grey and white histograms represent – and + Ruxolitinib in the presence of IFNγ. Black histogram represents unstimulated control. Dose dependent effect of Ruxolitinib on the mean fluorescent intensity (MFI) of pSTAT1 is shown on two independent PBMC and MSC donors. (C) HLADR- PBMCs (D) HLADR+ PBMCs (E) MSCs. Assays were done in duplicates. Average and Standard deviation is shown. Percentage MFI change is calculated based on pSTAT1 expression in the conditions of absence and presence of Ruxolitinib and IFNγ, respectively. Two-Way ANOVA multiple comparison test was performed between 0 nM and other Ruxolitinib concentrations. *, **, ***, **** represents P≤0.05, P ≤ 0.01, P ≤ 0.001 and P ≤ 0.0001 respectively. (F) Area Under Curve (AUC) values of HLADR- PBMCs, HLADR+ PBMCs and MSCs were plotted with average and standard deviation. Unpaired t test was perfored in Graphpad Prism to obtain statistical significance. * represents P≤0.05.

