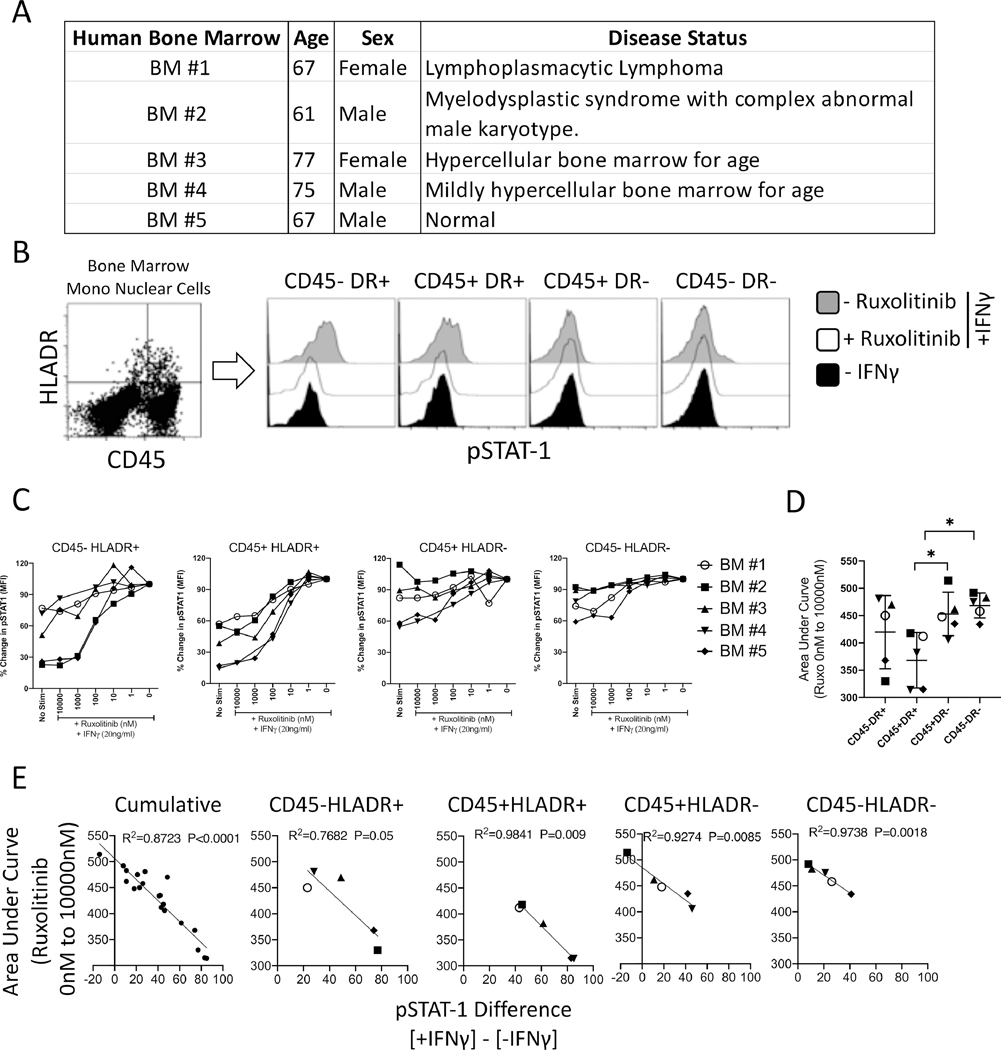
Figure 7. Effect of Ruxolitinib on CD45+/− and HLADR+/− populations of primary human bone marrow aspirates.
(A)Age, sex and disease status of primary bone marrow aspirates that are analyzed in this study is shown in a table format. (B) Primary bone marrow mononuclear cells (MNCs) were stimulated with IFNγ in the presence of varying concentrations of Ruxolitinib. Phosflow analysis was performed for pSTAT1 expression. MNCs were additionally stained for phosflow compatible HLADR and CD45 antibodies. (B) Representative histogram is shown for pSTAT1 expression in CD45-HLADR+, CD45+HLADR+, CD45+HLADR-, CD45-HLADR- populations of BM#5. Grey and white histograms represent – and + Ruxolitinib in the presence of IFNγ. Black histogram represents unstimulated control. (C) Dose dependent effect of Ruxolitinib on the mean fluorescent intensity (MFI) of pSTAT1 is shown on CD45-HLADR+, CD45+HLADR+, CD45+HLADR-, CD45-HLADR- populations of 5 independent primary bone marrow aspirates. Percentage MFI change is calculated based on pSTAT1 expression in the conditions of absence and presence of Ruxolitinib and IFNγ, respectively. (D) Area Under Curve (AUC) values of CD45-HLADR+, CD45+HLADR+, CD45+HLADR-, CD45-HLADR- populations were plotted with average and standard deviation. Unpaired t test was performed in GraphPad prism to obtain statistical significance. * represents P≤0.05. (E) Cumulative or independent Area Under Curve (AUC) values of CD45-HLADR+, CD45+HLADR+, CD45+HLADR-, CD45-HLADR- populations were subjected to linear regression analysis with the corresponding values of pSTAT-1 difference between + and -IFNγ stimulation. Regression analysis was performed in Graphpad Prism to obtain R2values and p values.

