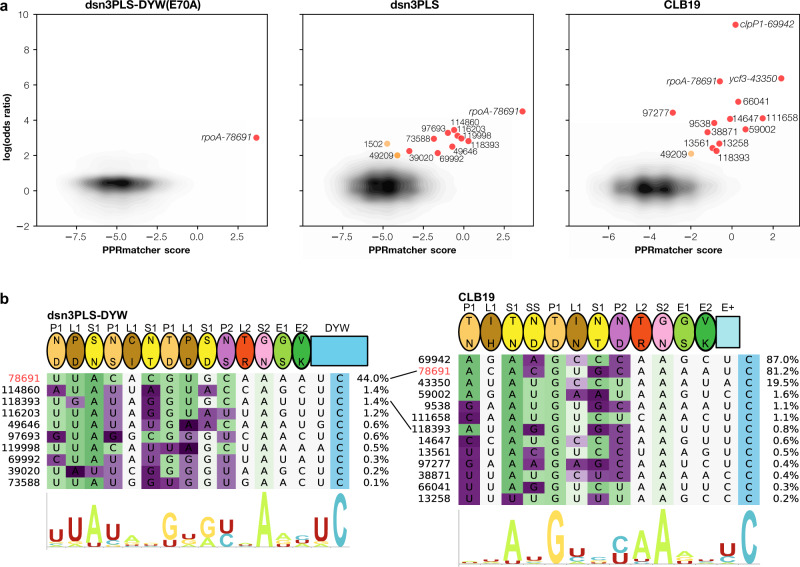
Fig. 4. Putative off-target editing by dsn3PLS-DYW and CLB19.
a Potential editing sites plotted by their predicted binding to the expressed editing factor (x-axis) against the ratio of the editing activity compared to a negative control (expressed as the log of the odds ratio). Predicted binding scores were calculated with PPRmatcher (https://github.com/ian-small/PPRmatcher). For dsn3PLS(E70A) the negative control was clb19, for dsn3PLS-DYW and CLB19, the negative control was dsn3PLS(E70A). All sites where the difference in editing is statistically significant (Fisher exact test corrected for multiple testing) and the log(odds ratio) is greater than 2 are highlighted in red (or orange for two potential ‘false positives’ discussed in the text). The ~32,000 sites below this threshold are indicated by the density contours (grey-black). b Alignment of the highlighted sites from a with the corresponding editing factor. The rpoA-78691 site is highlighted in red. The target sites are coloured according to the PPRmatcher score at each position, from favoured (green) to neutral (white) to disfavoured (purple). The percentage of edited transcripts at each site is indicated on the right. The sequence logos (constructed by Skylign59) indicate the nucleotide biases at each position.

