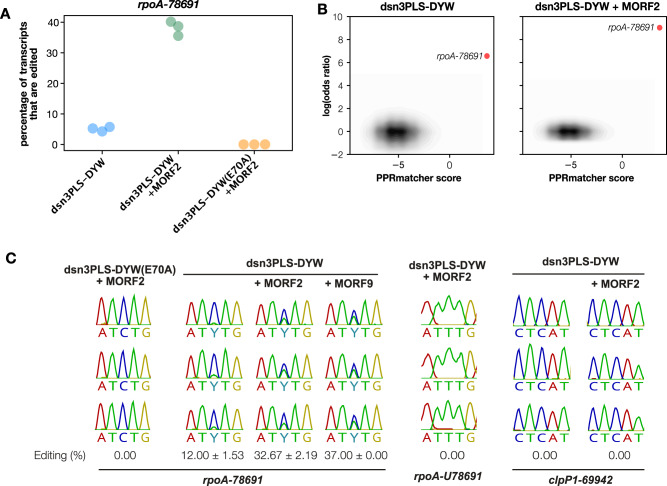
Fig. 5. RNA editing in bacteria.
A RNA editing quantified by RNAseq at the intended target site in three independent samples of bacteria expressing dsn3PLS-DYW, dsn3PLS-DYW together with MORF2 or dsn3PLS-DYW(E70A), together with MORF2. B Potential editing sites plotted by their predicted binding to dsn3PLS-DYW (x-axis) against the ratio of editing activity compared to the negative control (dsn3PLS-DYW(E70A) together with MORF2), expressed as the log of the odds ratio. Predicted binding scores were calculated with PPRmatcher (https://github.com/ian-small/PPRmatcher). The only significant site where the log(odds ratio) exceeds 2 is the intended target site, rpoA-78691, highlighted in red. The ~492,000 sites below this threshold are indicated by the density contours (grey-black). C Additional tests of editing in E. coli. From left to right: dsn3PLS-DYW(E70A) + MORF2 as a negative control; MORF2 and MORF9 enhance editing by dsn3PLS-DYW by similar amounts; a U at the rpoA-78691 editing position is not detectably reverse-edited to C; the clpP1-69942 site is not detectably edited with or without MORF2. All experiments were repeated in triplicate, as shown.

