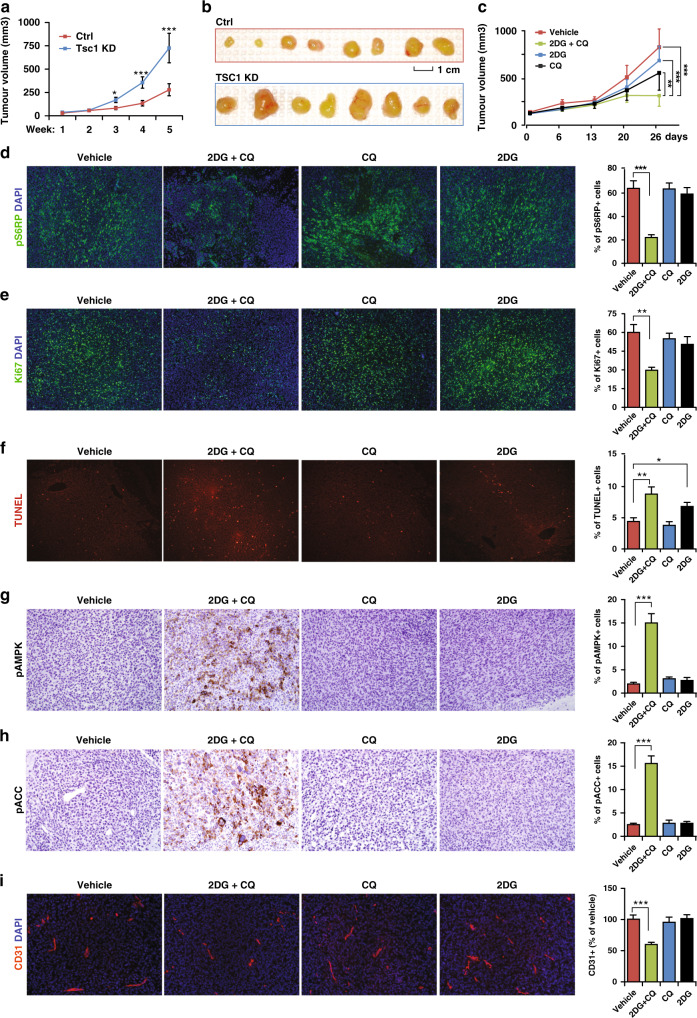
Fig. 5. Targeting autophagy and glycolysis in a subcutaneously transplanted GBM model.
a Growth curve of subcutaneously transplanted tumours from Ctrl LN229 cells and Tsc1 KD-1 LN229 cells for 5 weeks. b Images of tumours from Ctrl LN229 cells and Tsc1 KD-1 LN229 cells taken out 5 weeks after transplantation. c Growth curve of subcutaneously transplanted tumours from Tsc1 KD-1 LN229 cells treated with vehicle, 2DG, CQ and 2DG + CQ for 26 days. d–i Immunofluorescence (d–f, i) or immunohistochemistry images (g, h) and mean ± SE of the percentage (right bar graphs) of pS6RP+ cells (d), Ki67+ cells (e), TUNEL+ cells (f), pAMPK+ cells (g), pACC+ cells (h) of total cells in a section and relative CD31+ area (i) in TSC1 KD-1 LN229 tumours treated with vehicle, 2DG, CQ and 2DG + CQ for 26 days were shown. Data were analysed by two-way ANOVA (a, c) or one-way ANOVA with Tukey’s post-hoc test (d–i). n = 5 animals. *p < 0.05; **p < 0.01; ***p < 0.001. Bar = 1 cm for B and 100 μm for d–i.

