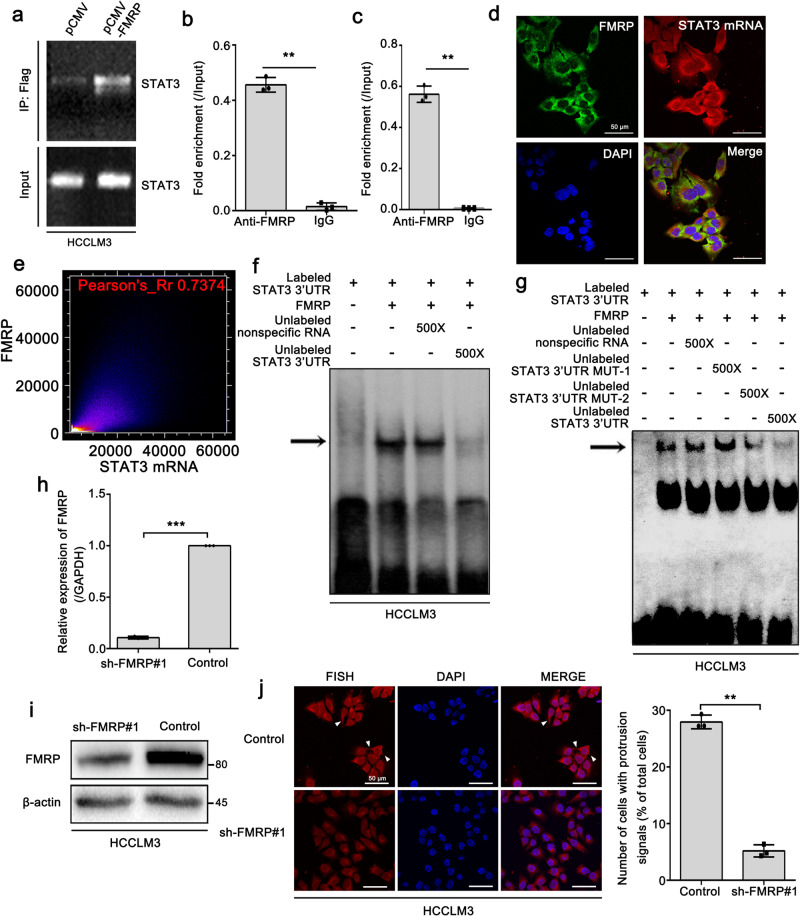
Fig. 3. FMRP interacts with STAT3 mRNA and facilitates its localization to cell protrusions.
a RNA immunoprecipitation (RIP) assay showing the binding of exogenous FLAG-tagged FMRP and STAT3 mRNA in HCCLM3 cells. b The interaction of endogenous FMRP with STAT3 mRNA in HCCLM3 cells assessed by RIP-qPCR. Error bars represent ±s.d. ***P < 0.001 (IgG compared with anti-FMRP) by two-tailed Student’s t-test. c The interaction of endogenous FMRP with STAT3 mRNA in the protrusions of HCCLM3 cells assessed by RIP-qPCR. Error bars represent ± s.d. ***P < 0.001 (IgG compared with anti-FMRP) by two-tailed Student’s t-test. d FISH assay displaying the colocalization of FMRP and STAT3 mRNA in the cytoplasm and protrusions of HCCLM3 cells. Scale bar: 50 μm. e Quantitative analysis of colocalization of d. The colocalization image was converted into a visual scatter plot. Most of the points are distributed on the diagonal, and the Pearson coefficient is 0.7374. In this case, it indicated that FMRP and STAT3 mRNA are colocalized. f FMRP binds to the 3′UTR of STAT3 mRNA. Aliquots of 32P-labeled 3′ UTR of STAT3 mRNA were incubated with recombinant FMRP. RNA-protein complexes (indicated by arrow) were formed when the RNA probe incubated with recombinant FMRP. The complexes were competed by 500× excess of unlabeled 3′ UTR of STAT3 mRNA, but not by the non-specific RNA (random tRNA). g The complexes of 32P-labeled 3′ UTR of STAT3 mRNA with FMRP were competed by 500× excess of unlabeled STAT3 3′ UTR MUT-2, but not by the unlabeled STAT3 3′ UTR MUT-1 and non-specific RNA (Random tRNA). h, i Stable knockdown of FMRP in HCCLM3 cells by lentiviral shRNA sequences (shFMRP). The knockdown effect was verified at both the mRNA and protein levels. j FISH imaging of STAT3 mRNA showing that knockdown of FMRP markedly abolished the protrusion-localization of STAT3 mRNA. The right panel is the quantitative analysis. Number of cells with protrusion signals was reported as a percentage of total cells. Scale bar: 50 μm. The values in the graphs represent the mean of three biologically independent experiments. Error bars represent ±s.d. *P < 0.05, **P < 0.01, ***P < 0.001 by two-tailed Student’s t-test.

