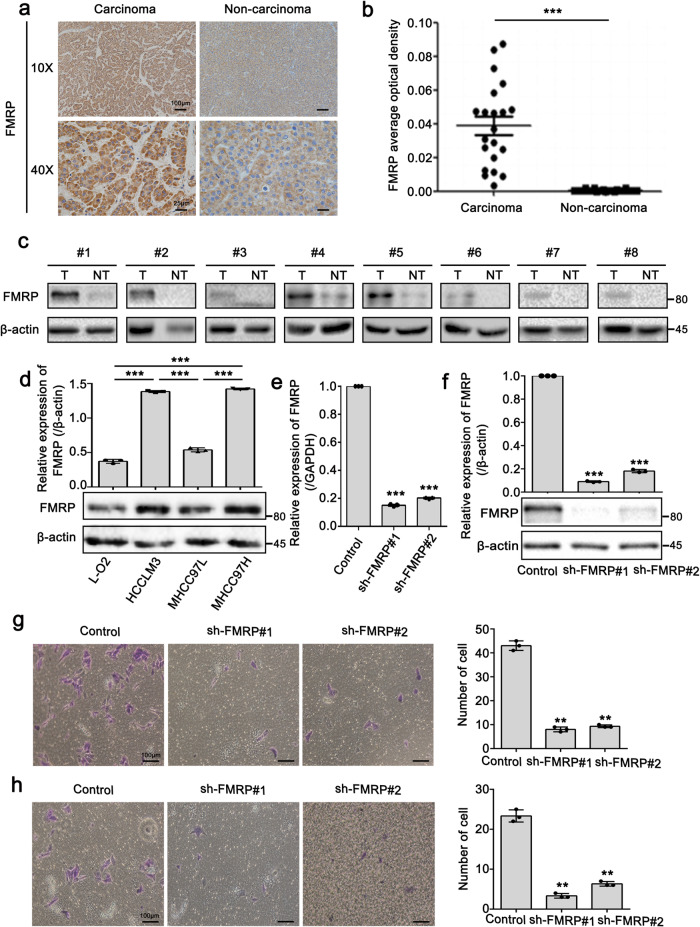
Fig. 5. FMRP knockdown suppresses the metastatic capacity of HCCLM3 in vitro.
a, b Representative IHC staining (a) and statistics of average optical density of FMRP (b) in matched carcinoma tissues and non-carcinoma tissues. n = 21 biologically independent samples. Scale bar (10×): 100 μm. c Western blot analysis of FMRP protein levels in 8 paired HCC tissues (T) and adjacent non-tumor tissues (NT). d Western blot analysis of FMRP in L-O2, HCCLM3, MHCC97L, and MHCC97H cells (lower panel) and quantification of the intensity relative to β-actin (upper panel). e, f Q-PCR (e) and western blot (f) analyses examined the knockdown efficiency of FMRP in FMRP-knockdown cells. g, h Transwell migration (g) and invasion assays (h) in Control and FMRP-knockdown cells. The right panel is the quantification of the left panel. Scale bar: 100 μm. The values in the graphs represent the mean of three biologically independent experiments. Error bars represent ±s.d. *P < 0.05, **P < 0.01, ***P < 0.001 by two-tailed Student’s t-test.

