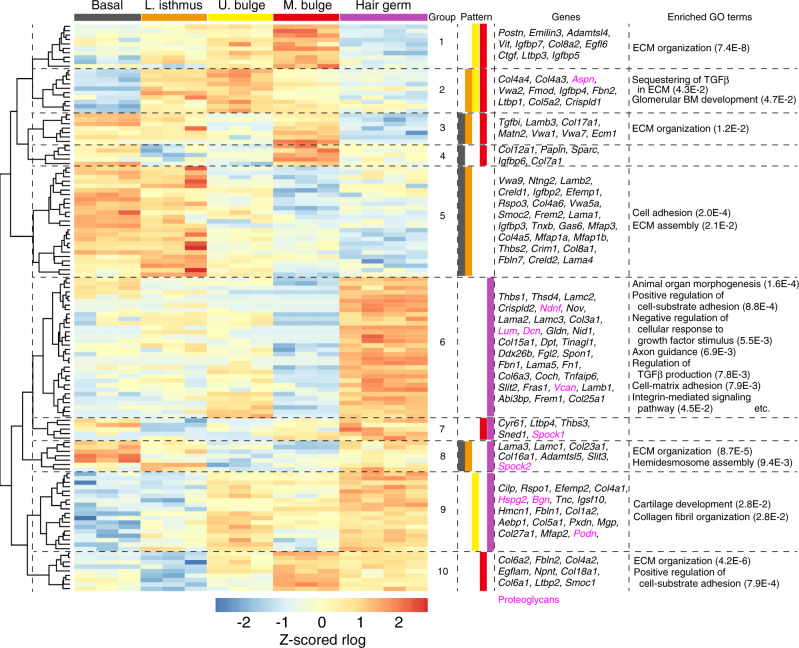
Fig. 3. Hierarchical clustering of differentially expressed matrisome genes in epithelial sub-populations.
Z-scored expression values (rlog normalized values) of each biological replicate are indicated according to a heat gradient as shown at the bottom of the heatmap. Dendrogram tree was cut at the height where it gave ten sub-gene groups (epi-groups 1–10). To annotate ECM gene expression patterns in each epi-group, the epithelial regions were statistically divided into two groups by k-means clustering. The cell group expressing the cluster-composing ECM genes at a level higher than the other group was classified as epithelial regions showing relatively high expression of cluster-composing ECM genes. The expression patterns of each epi-group are colour encoded. Genes in magenta indicate proteoglycans. Enriched GO terms analyzed with region-specific ECM genes are shown with their FDR values.

