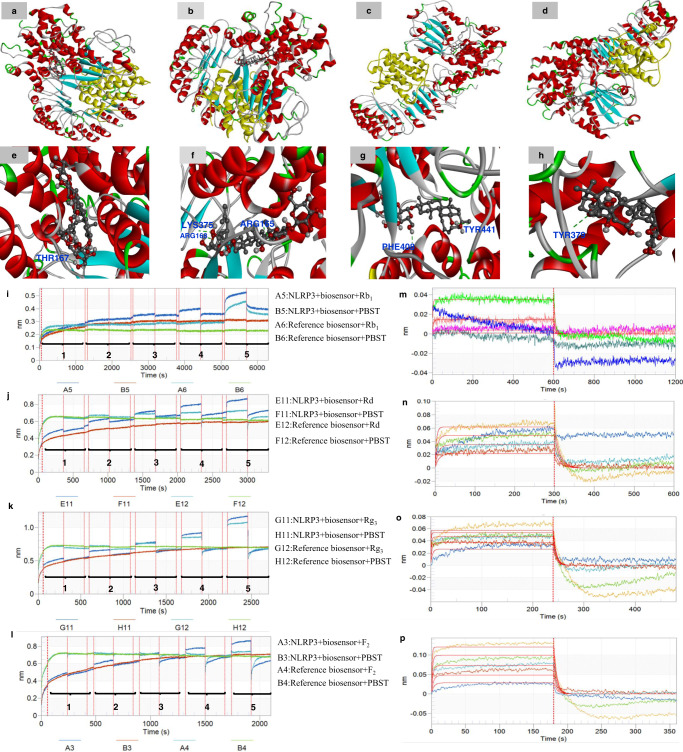
Fig. 4. Binding affinity of the ginsenoside analogues to NLRP3 was evaluated by molecular docking and bio-layer interferometry.
Molecular docking predicted the binding sites of ginsenoside analogues: a, e Rb1, b, f Rd, c, g Rg3, d, h F2 to NLRP3. The protein structure is demonstrated in ribbon format while ligand is represented in ball and stick format. Note: Red areas mean oxygen atom, grey areas mean carbon atom, blue areas mean nitrogen atom, white areas mean hydrogen atom and green areas mean other. The green dotted lines represent hydrogen bonds. Bio-layer interferometry validated the binding affinity of the ginsenoside analogues Rb1, Rd, Rg3, F2 to NLRP3. Typical kinetic characterization of NLRP3 to various concentrations of analogues by using BLI assay (n = 5). i Biosensors were exposed to various concentrations (marked 1–5) of Rb1 solution (1.44, 7.21, 36.1, 180.3, 901.7 μM) for association (600 s) and dissociation (600 s). j Biosensors were exposed to Rd solution (9.06, 18.1, 36.3, 72.6, 145.2 μM) for association (300 s) and dissociation (300 s). k Biosensors were exposed to Rg3 solution (7.18, 14.4, 28.7, 57.4, 114.8 μM) for association (240 s) and dissociation (240 s). l Biosensors were exposed to F2 solution (14.2, 28.3, 56.6, 113.2, 226.4 μM) for association (180 s) and dissociation (180 s). Association and dissociation steps are divided by the dotted line. Panels (m–p) represent Rb1, Rd, Rg3 and F2 in the association and dissociation steps in order to fit results globally with a 1:1 binding model and get the best values of kon, kdis and KD.

