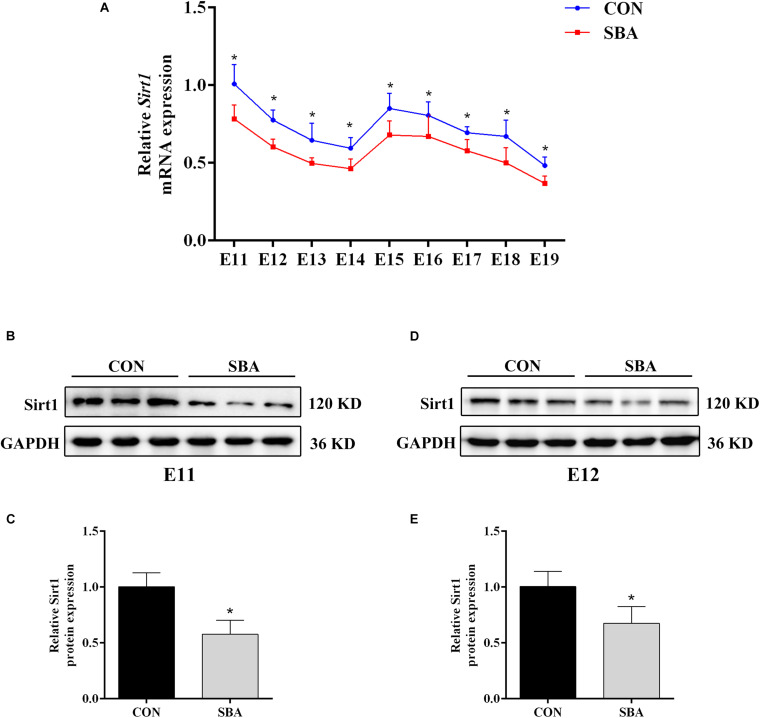
FIGURE 2.
Sirt1 expression in ATRA-induced SBA. (A) Relative Sirt1 mRNA expression in rat embryonic spinal cord tissues of the CON and SBA groups from E11 to E19 as assessed by RT-qPCR (n = 5). Results are expressed as the mean ± SD. *p < 0.05 vs. control group. (B) Western blot of Sirt1 in rat embryonic spinal cord tissues on E11 in the CON and SBA groups. (C) Quantitation of Sirt1 protein on E11 (n = 6). (D) Western blot of Sirt1 in rat embryonic spinal cord tissues on E12 in the CON and SBA groups. (E) Quantitation of Sirt1 protein on E12 (n = 6). Results are expressed as the mean ± SD. *p < 0.05 vs. control group.

