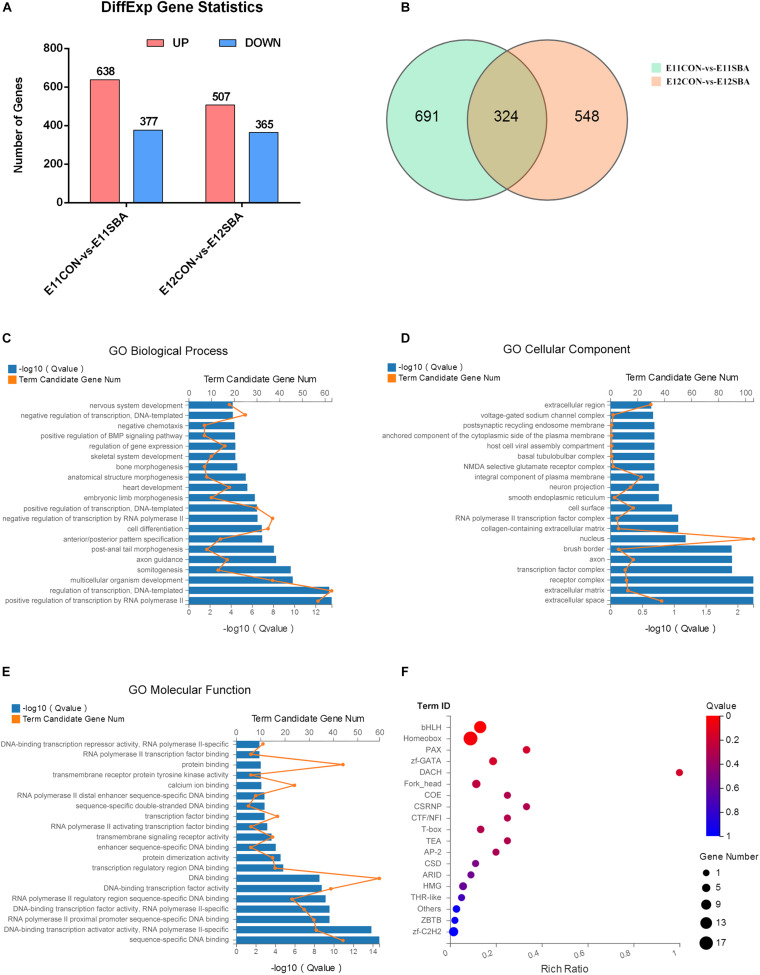
FIGURE 4.
Transcriptome alterations in the ATRA-induced SBA rat model (E11 and E12). (A) Number of DEGs between SBA and CON rat embryos on E11 and E12. DESeq2 | log2FC| ≥ 0.3, Q ≤ 0.05. (B) Venn diagram of DEGs in E11CON vs. E11SBA and E12CON vs. E12SBA. (C) Top 20 enriched BP terms in GO analysis. (D) Top 20 enriched CC terms in GO analysis. (E) Top 20 enriched MF terms in GO analysis. (F) Transcription factor enrichment analysis of DEGs. Terms were considered significantly enriched when Q ≤ 0.05.

