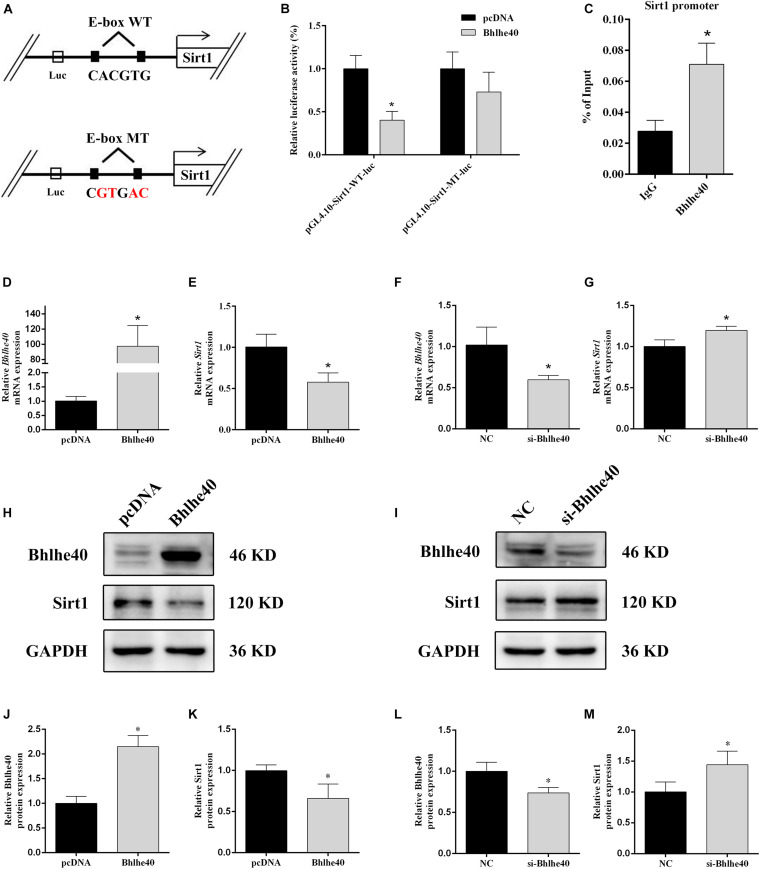
FIGURE 6.
Bhlhe40 negatively regulates Sirt1. (A) Schematic representation of Sirt1 mRNA depicting Bhlhe40-binding sites in its promoter. (B) Luciferase reporter assays were conducted using a Sirt1 promoter with deleted E-box motifs after C17.2 cells were transfection with pcDNA or Bhlhe40 (n = 3). Results are expressed as the mean ± SD. *p < 0.05 vs. Sirt1-promoter-WT-luc + pcDNA group. (C) Binding of Bhlhe40 to Sirt1 promoters was examined in C17.2 by ChIP assay. Results are expressed as the mean ± SD. *p < 0.05 vs. IgG group. (D) RT-qPCR analysis of the Bhlhe40 mRNA level in C17.2 cells transfected with pcDNA or Bhlhe40 (n = 3). (E) RT-qPCR analysis of the Sirt1 mRNA level in C17.2 cells transfected with pcDNA or Bhlhe40 (n = 3). (F) Western blot analysis of Bhlhe40 and Sirt1 protein levels in C17.2 cells transfected with pcDNA or Bhlhe40. (G) Quantitation of Bhlhe40 (n = 3). (H) Quantitation of Sirt1 (n = 3). Results are expressed as the mean ± SD. *p < 0.05 vs. pcDNA group. (I) RT-qPCR analysis of the Bhlhe40 mRNA level in C17.2 cells transfected with NC or si-Bhlhe40 (n = 3). (J) RT-qPCR analysis of the Sirt1 mRNA level in C17.2 cells transfected with NC or si-Bhlhe40 (n = 3). (K) Western blot analysis of Bhlhe40 and Sirt1 protein levels in C17.2 cells transfected with NC or si-Bhlhe40. (L) Quantitation of Bhlhe40 (n = 3). (M) Quantitation of Sirt1 (n = 3). Results are expressed as the mean ± SD. ∗p < 0.05 vs. NC group.

