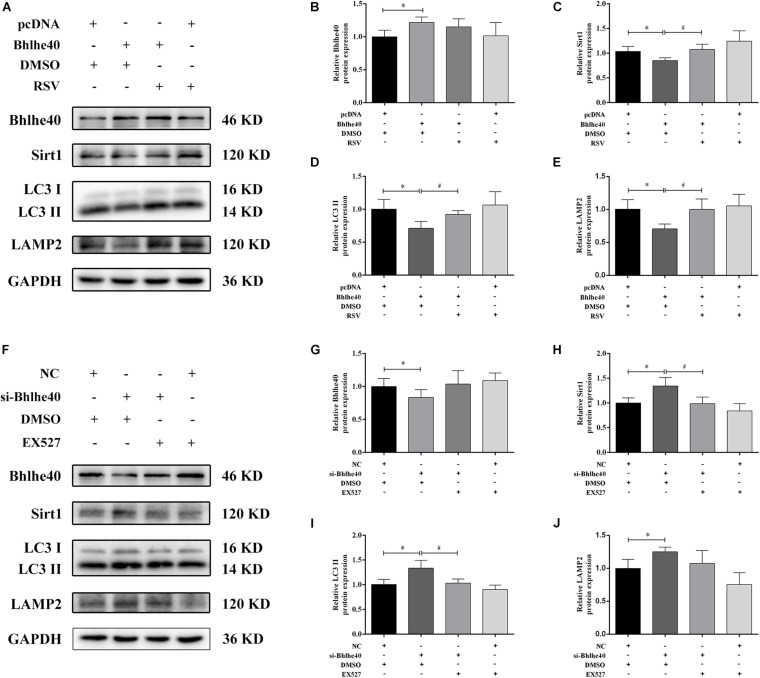
FIGURE 7.
The Bhlhe40/Sirt1 axis regulates autophagy/mitophagy-related proteins in C17.2 cells. (A) Western blot analysis of Bhlhe40, Sirt1, LC3, and LAMP2 protein levels in C17.2 cells treated with different combinations of pcDNA, Bhlhe40, DMSO, and RSV. Quantitation of Bhlhe40 (B), Sirt1 (C), LC3 II (D), and LAMP2 (E) protein (n = 3). Results are expressed as the mean ± SD. ∗p < 0.05 vs. pcDNA + DMSO group; #p < 0.05 vs. Bhlhe40 + DMSO group. (F) Western blot analysis of Bhlhe40, Sirt1, LC3 II, and LAMP2 protein in C17.2 cells treated with different combinations of NC, si-Bhlhe40, DMSO, and EX527. Quantitation of Bhlhe40 (G), Sirt1 (H), LC3 (I), and LAMP2 (J) protein (n = 3). Results are expressed as the mean ± SD. ∗p < 0.05 vs. NC + DMSO group; #p < 0.05 vs. si-Bhlhe40 + DMSO group.

