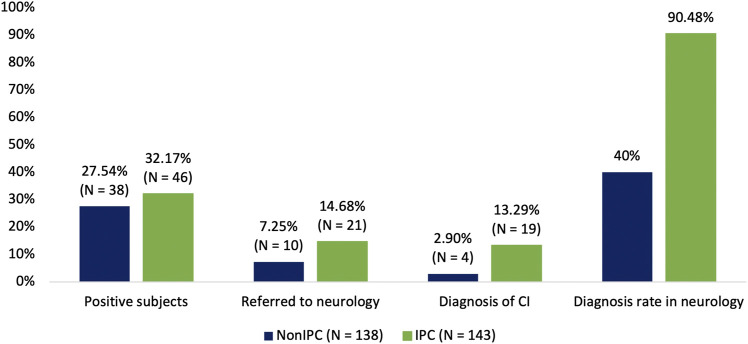
FIGURE 3.
Differences between NonIPC group and IPC group regarding the percentage of positive subjects, the percentage of subjects referred to neurology, and the percentage of subjects diagnosed with CI. The last diagram bar represents the diagnosis rate in neurology in both groups concerning the overall referred subjects.

