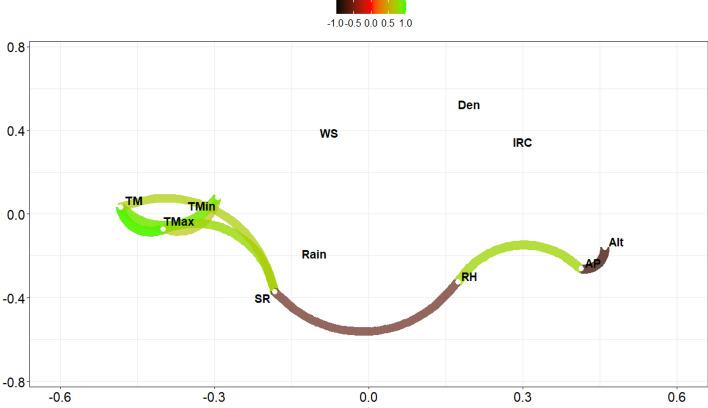
Figure 1.
Correlations plot of environmental database COVID-19. Green paths indicate positive correlations, brown paths negative correlations. TM= Average atmospheric temperature; TMax = Maximum atmospheric temperature; TMin = Minimum atmospheric temperature; RH = Relative humidity; Rain = Accumulated precipitation; AP = Atmospheric pressure; SR = Ultraviolet solar radiation; WS = Wind speed; Alt = Elevation; Den = Population density; IRC = Infection rate.

