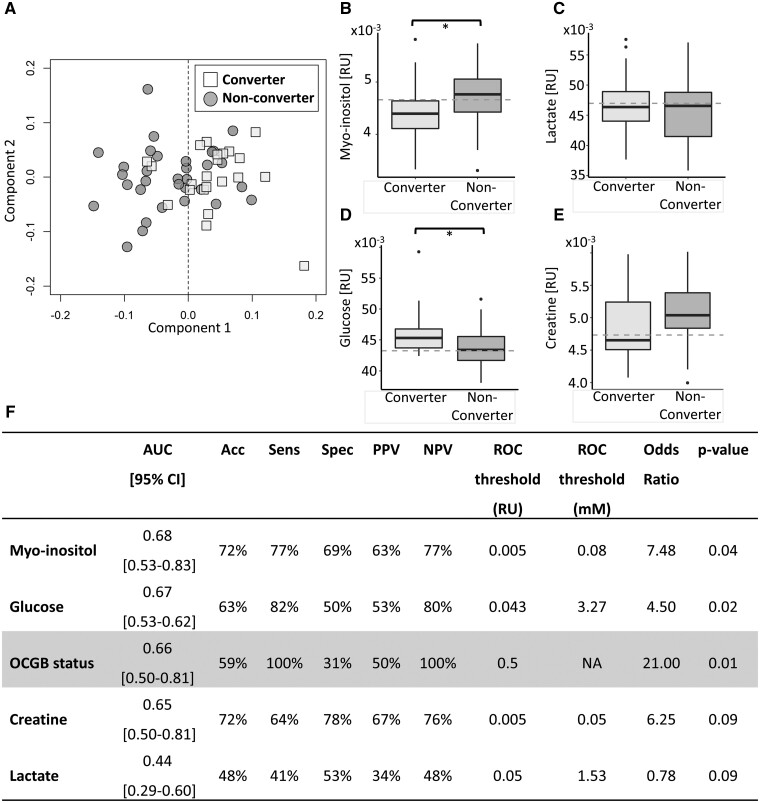
Figure 2.
Metabolomics results. (A) Representative OPLS-DA scores plot illustrating discrimination between clinically defined converters (square) and non-converters (circle) CSF metabolite profiles. (B–E) Boxplots of the significant discriminatory metabolites identified by the OPLS-DA analysis in clinically defined converters and non-converters. Dashed lines represent the optimal threshold to achieve the greatest accuracy as determined by ROC analysis. For univariate analysis, two-sample t-tests were used for continuous variables while Chi-square tests were used for categorical variables as appropriate. While for multivariate analysis a two-sided Kolmogorov–Smirnov test was used to determine the significance of the OPLS-DA performance on independent test data relative to the null distribution. A Bonferroni correction to account for multiple comparisons was applied throughout. Univariate P-values below 0.05, 0.01 and 0.001 are represented by *, ** and ***, respectively. (F) Predictive performance of identified CSF metabolite biomarkers compared to the performance of OCGB status. Biomarkers are listed from highest to lowest AUC. Acc, Accuracy; AUC, area under the curve; CI, confidence interval; PPV, positive predictive value; ROC, receiver operator curve; NPV, negative predictive value; Sens, Sensitivity; Spec, specificity. Clinically defined converter n = 22, clinically defined non-converter n = 32.

