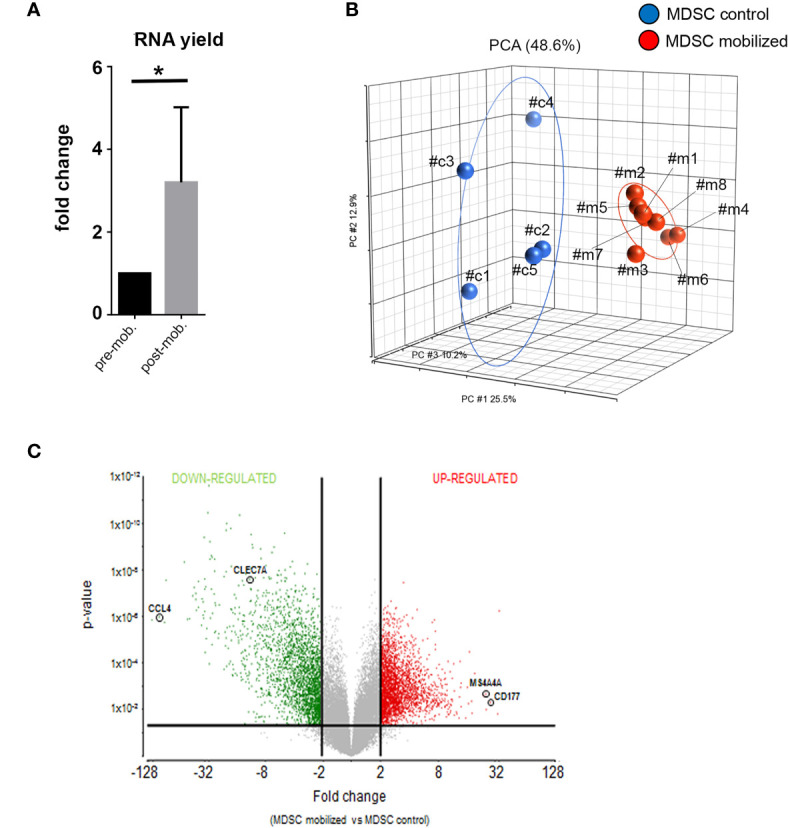
Figure 2.

Global gene expression analysis reveal distinct transcriptional profiles in mobilized PMN-MDSCs. (A) Total RNA yield obtained from freshly-isolated PB PMN-MDSCs of donors before (pre-mob) and after mobilization (mob). Data are expressed as fold change with respect to non-mobilized samples. Bars indicate SD. *p-value ≤ 0.05 (Student’s t-test). (B) Principal Component Analysis (PCA) summarization of microarray data for non-mobilized (MDSC control; blue circles; n = 5) and mobilized (MDSC mobilized; red circles; n = 8) PMN-MDSCs. (C) Volcano plot representing DEGs between mobilized and non-mobilized PMN-MDSCs upon ANOVA of microarray data. Vertical lines indicate FC≤-2 and ≥2, and horizontal line indicates p-value ≤ 0.05, representing cut-off lines applied to filter significant DEGs. Probeset significantly up-regulated and down-regulated are highlighted in red or green, respectively. The positions of CCL4, CLEC7A, MS4A4A, and CD177 genes in the volcano plot are highlighted.
