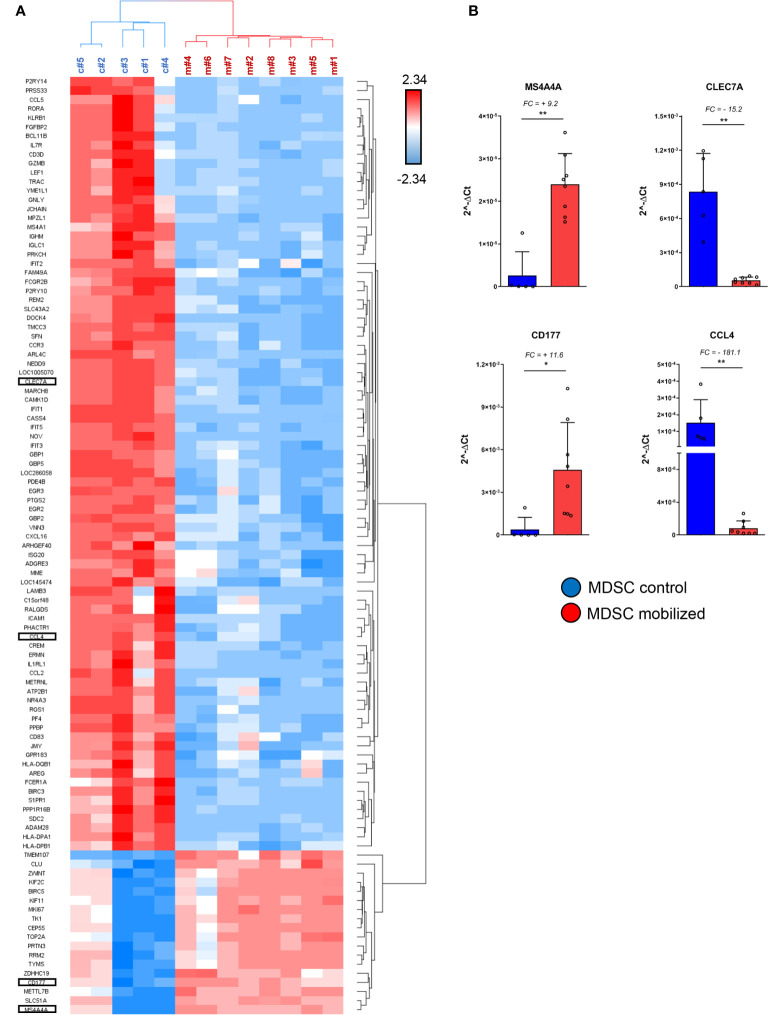
Figure 3.
Specific immuno-modulatory genes are differentially expressed in mobilized PMN-MDSCs. (A) Heat-map of the top up-regulated and down-regulated genes in PMN-MDSCs, based on the filter FC ≥10 or ≤-10; FDR adjusted p-value ≤ 0.05. Red squares indicate up-regulated genes; blue squares down-regulated genes in mobilized PMN-MDSCs. Each row represents a gene; each column represents individual samples analyzed by microarray (control: c#1–5; mobilized: m#1–8). Specific genes selected for further analysis are highlighted. (B) Real time PCR analysis on the samples used for microarray for the indicated genes. Values were calculated with ΔCt method. 18S was used as endogenous control. Bars indicate SD. *p-value ≤ 0.05; **p-value ≤0.01 (Mann–Whitney test).

