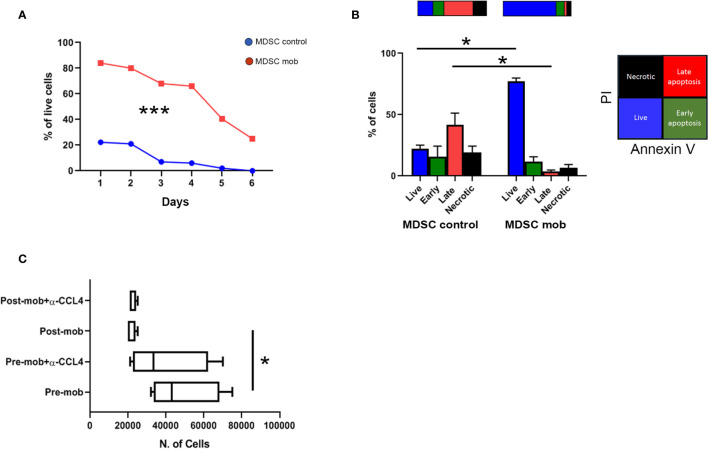
Figure 4.
Prolonged survival and altered chemo-attraction of mobilized PMN-MDSCs. (A) Percentages of PMN-MDSC live cells (PI-) along 6 days of non-mobilized (PMN-MDSCs ctrl, red square line) and mobilized (PMN-MDSCs mob, blue dots line) donors. ***p-value < 0.001 (two-way ANOVA test, n = 3). (B) Percentages of live (Annexin V- and PI-, blue), early apoptotic (Annexin V+ and PI-, green), late apoptotic (Annexin+ and PI+, red), and necrotic (Annexin V- and PI+, black) control (left) and mobilized (right) PMN-MDSCs measured by flow cytometry after 24 h of culture. *p-value ≤ 0.05; (Mann–Whitney test, n = 4). (C) Numbers of migrated NK cells after 1 h of culturing in conditioned medium derived from pre- and post-mobilized PMN-MDSC, in the presence or not of anti-CCL4 blocking antibody. *p-value ≤ 0.05; (Mann–Whitney test, n = 4).

