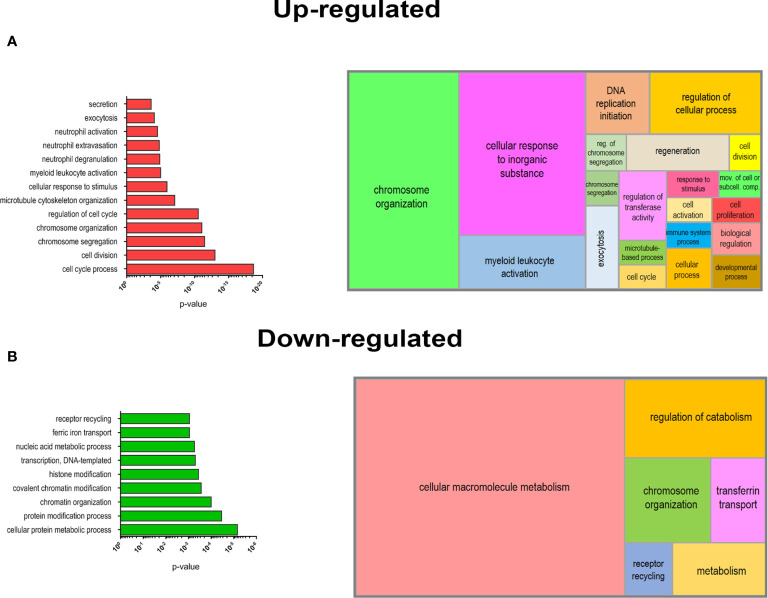
Figure 5.
Biological processes (BPs) enrichment in DEGs of mobilized PMN-MDSCs. Selected list of BPs from the GO database enriched for up-regulated (A) o r down-regulated (B) genes of mobilized PMN-MDSCs (left panels). Histrograms represent −log10 p-value for each enriched BP calculated by GOrilla tool (see Materials and Methods). Graphical summarization of the GO BPs significantly enriched in up-regulated and down-regulated gene lists is shown with a semantic clustering performed by REVIGO tool (right panels).

