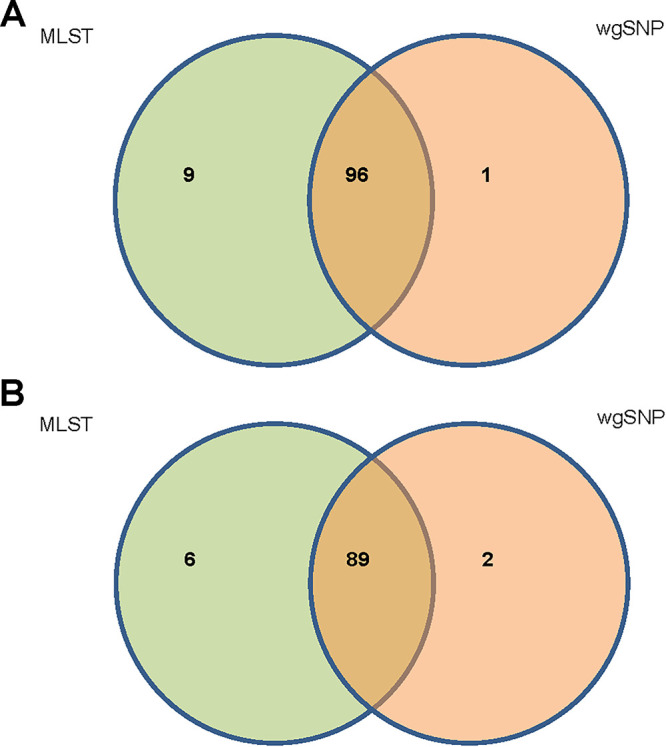
FIG 2.

Venn diagram of isolate clustering with MLST and wgSNP analysis. (A) Hospital A isolates. wgSNP analysis confirmed clustering of 96 isolates within their correct ST types. (B) Hospital B isolates. wgSNP analysis confirmed clustering of 89 isolates within their correct ST types.
