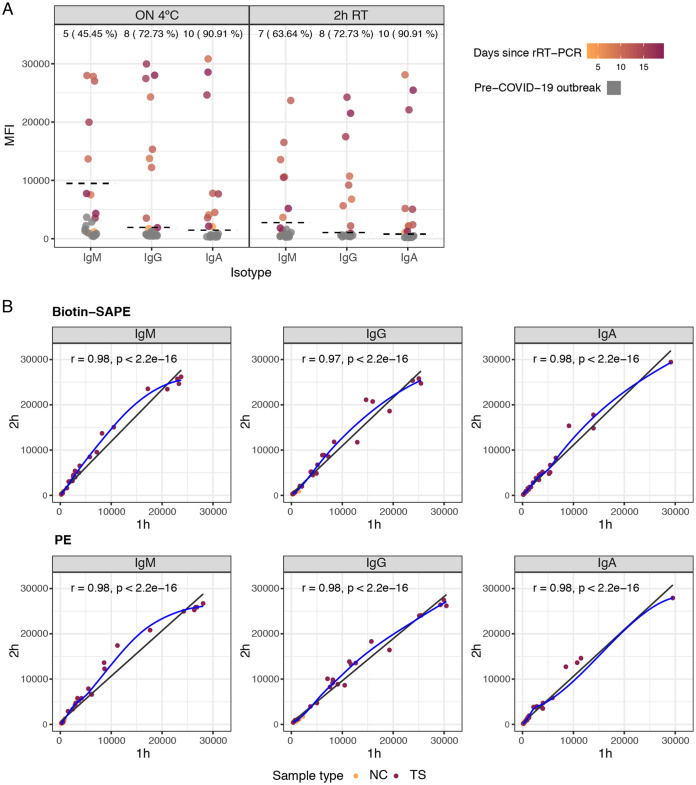
FIG 2.
Levels of IgM, IgA, and IgG antibodies (MFI) to RBD antigen of SARS-CoV-2 in positive and negative plasma samples (1/500 dilution) comparing incubation overnight (ON) at 4°C versus 2 h at room temperature (RT) (A) and 2 h versus 1 h at RT with two different secondary antibodies (B). In panel A, the dashed lines indicate cutoff values; the numbers and percentages of seropositive samples among rRT-PCR-positive samples are shown at the top of the dot plots. In panel B, the blue fitting curve was calculated using the LOESS (locally estimated scatterplot smoothing) method, and the black line was calculated by linear regression. The Spearman test was used to assess the correlations. Biotin-SAPE refers to secondary antibodies conjugated to biotin and streptavidin-phycoerythrin (SAPE), and PE refers to secondary antibodies conjugated with phycoerythrin. NC, negative controls; TS, test samples.

