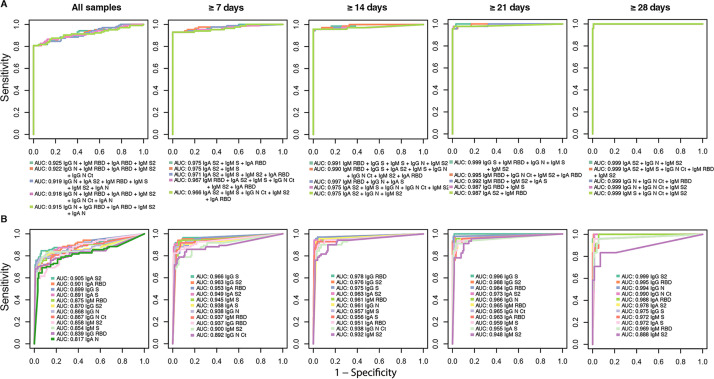
FIG 5.
Antibody Luminex assay performance. Shown are receiver operating characteristic (ROC) curves and areas under the curve (AUCs) using samples from prepandemic negative controls plus either all participants with a positive COVID-19 diagnosis or participants with a positive diagnosis at different times since the onset of symptoms. ROC curves and AUCs from different combinations of multiple immunoglobulin isotypes to different antigens with top performances are included in panel A, whereas those of single isotype/antibody markers are included in panel B.

