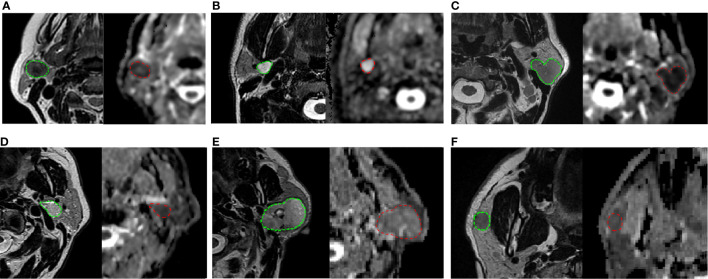
Figure 1.
On the top: three correctly classified lesions in the training dataset: (A) Warthin’s tumor with low T2 intensity, ovoidal shape and decreased ADC value (P25 of ADC = 0.834 × 10⁻³ mm2/s), (B) pleomorphic adenoma with typical T2 hyperintensity, sharp margins and high ADC value (P25 of ADC is 1.693 × 10⁻³ mm2/s) (C) malignant tumor with irregular margins, T2 hypointensity and low ADC value, (P25 = 0.744 × 10⁻³ mm2/s). At the bottom: three misdiagnosed cases in the validation set: (D) Warthin’s tumor with high T2 hyperintensity and irregular shape (P25 of ADC = 0.930 × 10⁻³ mm2/s); (E) pleomorphic adenoma with no typical T2 intensity and low ADC value (P25 of ADC = 1.109 × 10⁻³ mm2/s); (F) malignant tumor with typical very low T2 intensity but regular and sharp margin and ovoidal shape (P25 of ADC = 0.836 × 10⁻³ mm2/s). Each frame illustrates T2-weighted axial image with the user-defined lesion contour on the left and the corresponding ADC map on the right.

