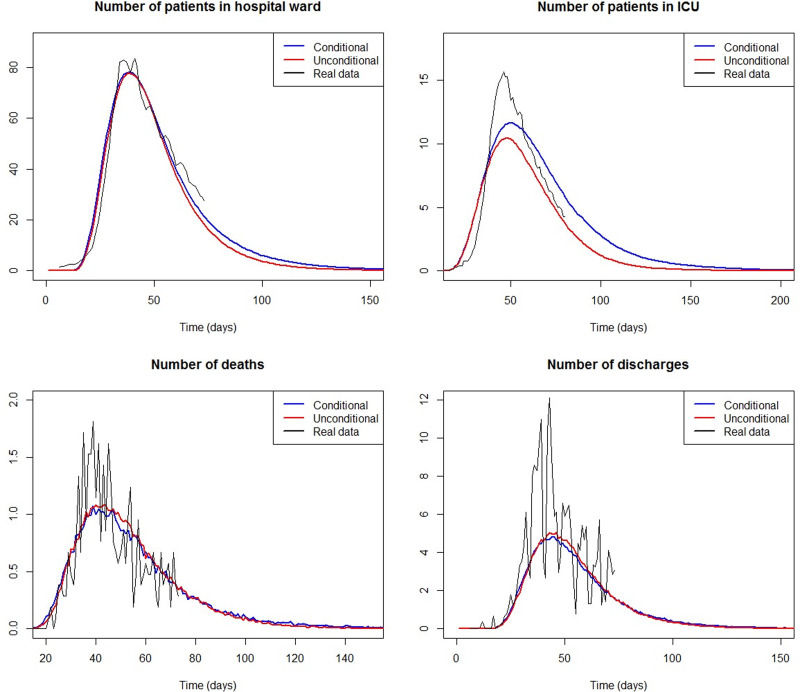
Fig. 3.
Number of patients in HW (top left), ICU (top right), deaths (bottom left) and discharges (bottom right) computed from 1000 simulated COVID-19 outbreaks for a period of 200 days, when the LoS are simulated depending on age and sex (blue), and unconditionally ignoring age and sex dependence (red). The real case counts of inpatients in the COVID-19 dataset from March 6th (day 1) to May 7th 2020 (day 62), rescaled to N = 1000 infected people, are also included for reference (solid black line).

