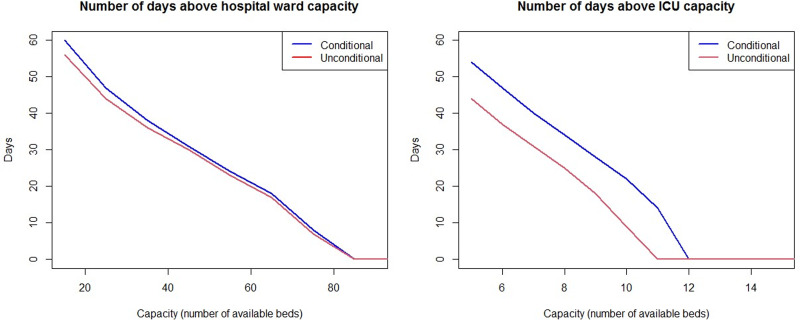
Fig. 4.
Number of days when the demand for beds is above the capacity in HW (left) and ICU (right), for different possible capacities and computed from 1000 simulated COVID-19 outbreaks. The demand was simulated conditionally depending on age and sex (blue), and unconditionally ignoring age and sex dependence (red).

