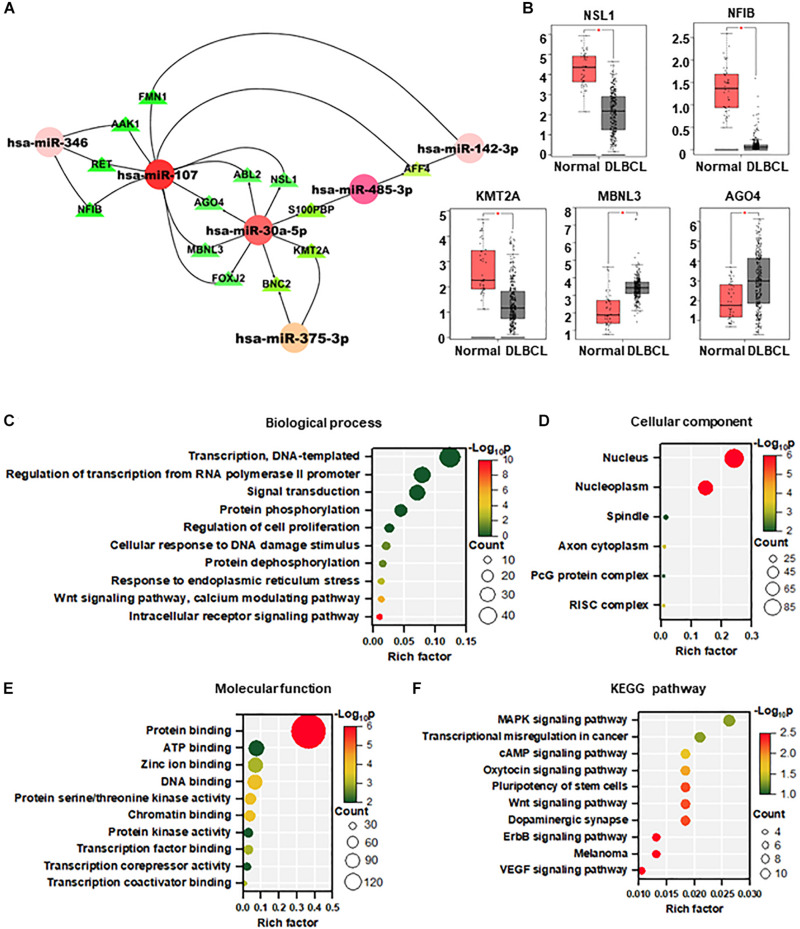
FIGURE 2.
Targets prediction and functional enrichment analysis of DEMs. (A) MiRNA–mRNA interaction network based on the hot miRNAs. (B) Target gene expression in DLBCL from the GEPIA database (normal = 337, DLBCL = 47). (C–F) Visualization of GO enrichment analysis (C–E) and KEGG pathway enrichment analysis (F) of 484 target genes of DEMs. The Y-axis stands for terms, and the X-axis represents the rich factor. The significance of the term is described by the color with red representing the highest significance. The count of the gene enrichment in the term is described by the size of the node. GO, gene ontology; KEGG, Kyoto Encyclopedia of Genes and Genomes.

