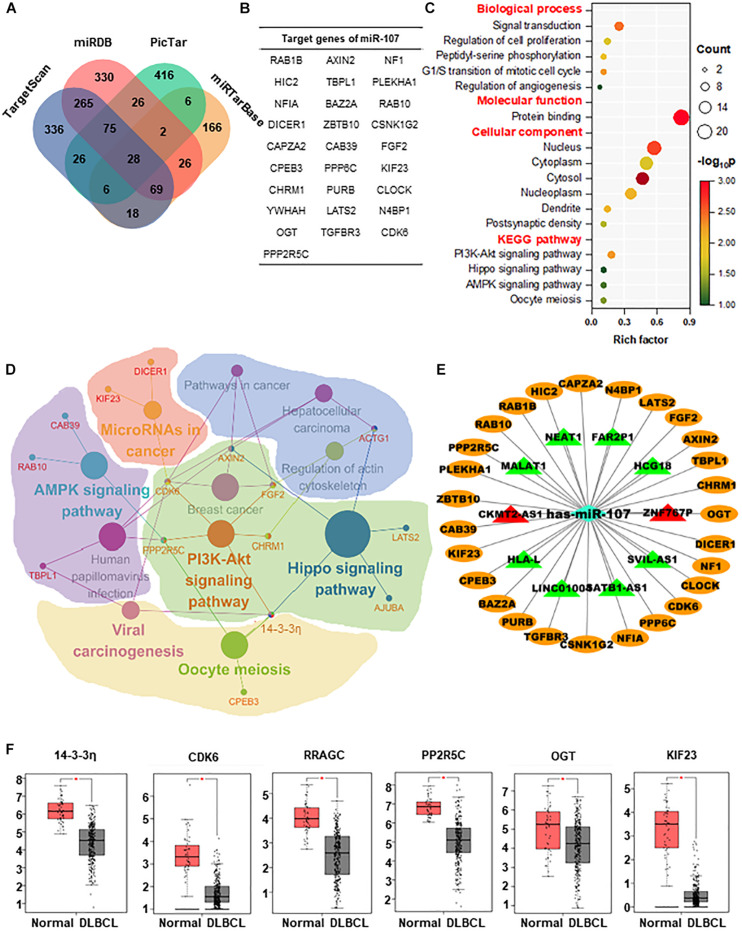
FIGURE 5.
Enrichment analysis and regulatory networks of miR-107. (A) Venn diagram indicates 28 potential target genes of miR-107 predicted by four databases, including TargetScan, miRDB, miRTarBase, and PicTar. (B) Table of target genes of miR-107. (C) GO enrichment and KEGG analysis of target genes by DAVID. (D) Representative biomolecular network about 28 genes targeted by miR-107 and corresponding pathways against KEGG. (E) LncRNA–miRNA–mRNA network predicted by Cytoscape. Target genes of miR-107 are represented as oval-shaped nodes. LncRNAs are represented as triangle-shaped nodes. Red indicates upregulation, and green indicates downregulation. (F) Target genes upregulated in DLBCL from GEPIA database (Normal = 337, DLBCL = 47) *p < 0.05.

