Figure 4.

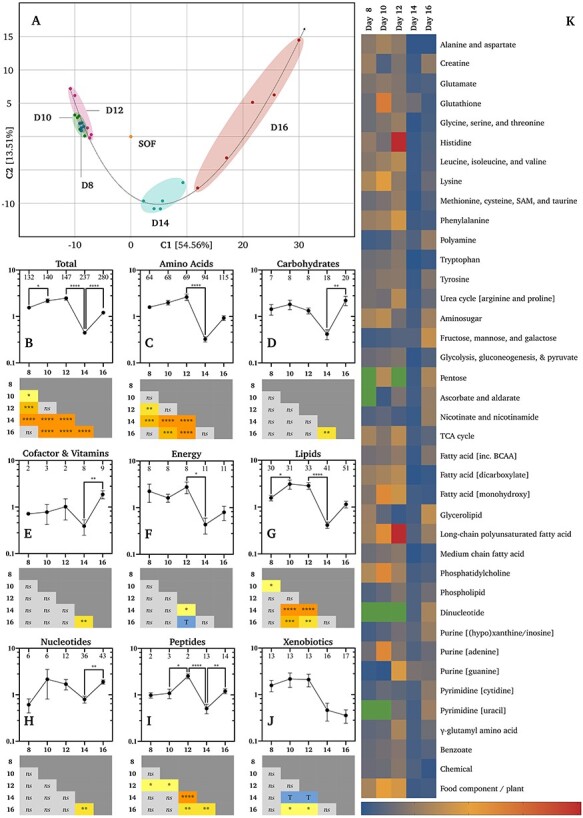
Protein-normalized semi-quantitative metabolomics. (A) Principal component analysis of biochemical profiles of synthetic oviduct fluid (SOF) and conceptus conditioned medium (CCM) by developmental stage (Days 8–16). Relative mean (±SEM) concentrations (n = 5 per group) of (B) all metabolites, (C) amino acid, (D) carbohydrate, (E) cofactor and vitamin, (F) energy substrate, (G) lipid, (H) nucleotide, (I) peptide, and (J) xenobiotic related metabolites (vertical axes) by day (horizontal axes). Numbers of identified metabolites within each group are provided within the upper frame of each graph. Differences determined by ordinary one-way analysis of variance coupled to a Tukey non-parametric post hoc test (**** = P ≤ 0.0001, *** = P ≤ 0.001, ** = P ≤ 0.01, and * = P ≤ 0.05). (K) Heat-maps of metabolite fold-changes about the mean by sub-pathway across days. Green cells denote a lack of identified metabolites, whereas blue to red (bottom-right) denotes the scaled intensity of the change. Additional abbreviations: s-adenosyl methionine (SAM), tricarboxylic acid cycle (TCA), and branch-chain amino acids (BCAA).
