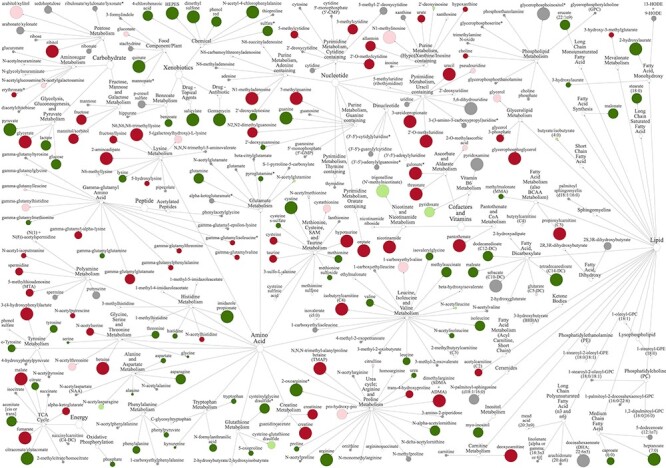
Figure 5.

Filamentous vs. tubular conceptus biochemical turnover. Network view of metabolites within corresponding super-pathways and sub-pathways in the conceptus-conditioned media on Day 16 vs. 14 when normalized for total protein. Node diameter and color describe metabolite fold-change magnitude and directionality, respectively: Dark red and dark green respectively indicate an increase or decrease (P ≤ 0.05), whereas pink or light green denote a trend (0.05 < P < 0.10) towards a respective increase or decrease. Gray depicts a lack of a statistically significant difference. Asterisks denote predicted metabolites.
