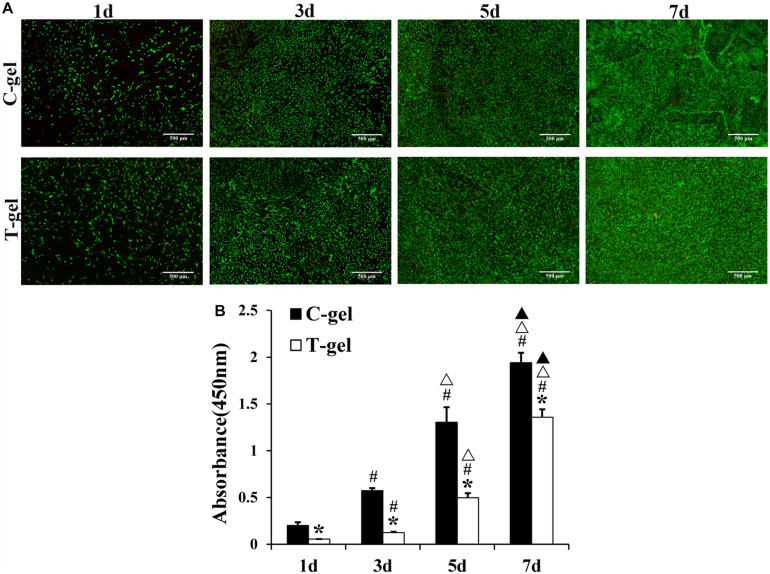
FIGURE 8.
Cell proliferation assays of the C-gel and T-gel. (A) Live/Dead staining of mTDSCs seeded on the C-gel and T-gel at 1, 3, 5, and 7 days by fluorescence microscopy (green, live cells; red, dead cells). Scale bar = 500 μm. (B) Cell proliferation of mTDSCs cultured on the C-gel and T-gel for 1, 3, 5, and 7 days as determined by the CCK-8 assay. *, signifies a P-value of <0.05 as compared to the C-gel; #, signifies a P-value of <0.05 as compared to 1 day for each gel; △, signifies a P-value of <0.05 as compared to 3 days for each gel; ▲, signifies a P-value of <0.05 as compared to 5 days for each gel.

