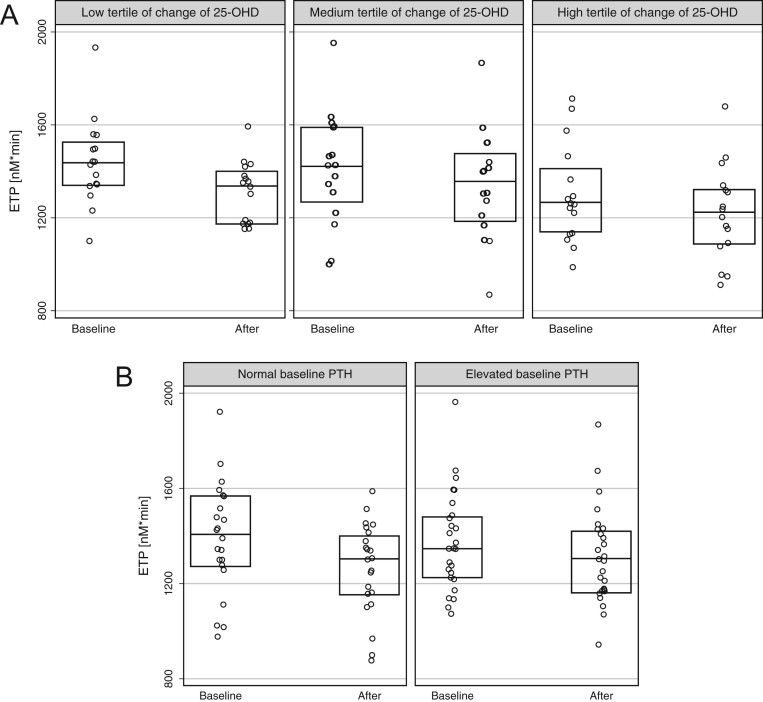
Figure 2.
Boxplots (median and 25/75th percentile) of endogenous thrombin potential. (A) In subgroups of tertiles of change of 25-OHD levels over the study period (1 = 7−34 mM; 2 = 35−52 mM; 3 = 53−99 mM). (B) In subgroups of baseline PTH. Results are statistically different (P < 0.05) in all five subgroups.

 This work is licensed under a