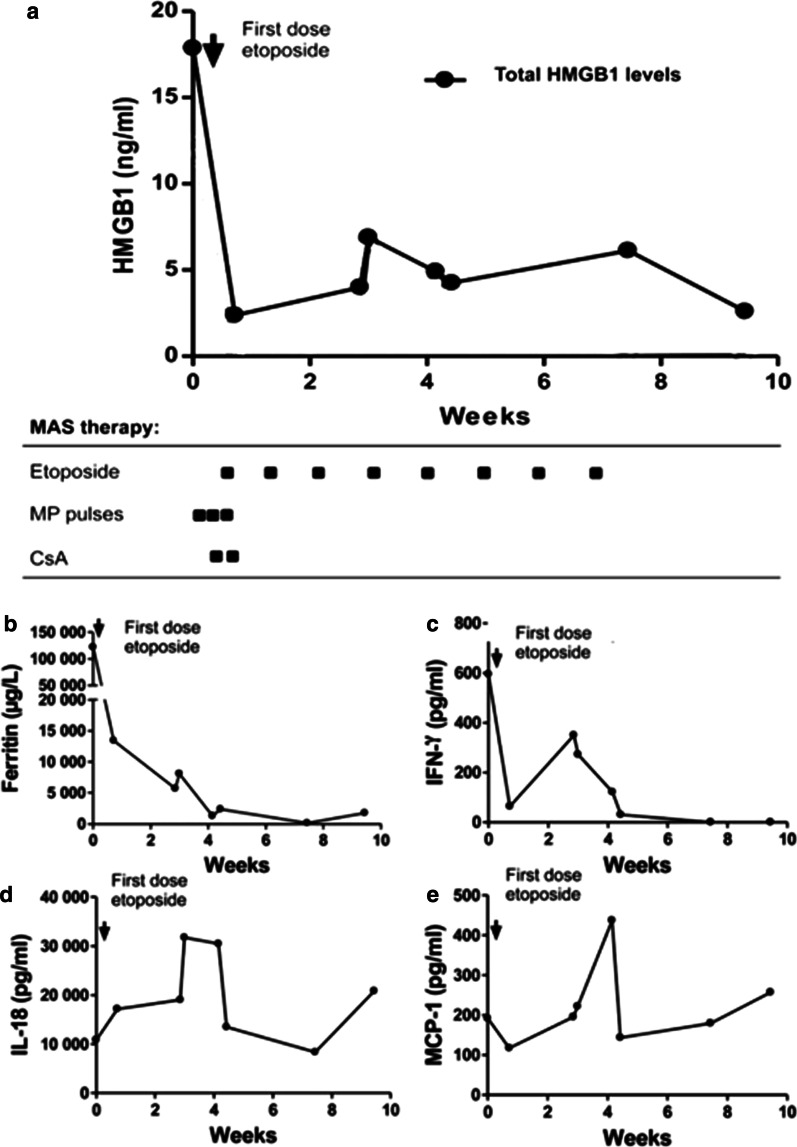
Fig. 4.
Longitudinal serum analyses before and after introduction of etoposide treatment in patient #4. The expression of plasma levels of HMGB1 (a), and serum levels of ferritin (b), IFN-γ (c), and IL-18 (d) corresponded very well to the clinical course of MAS with a rapid decline and clinical improvement after etoposide administration. MCP-1 levels were increased during the whole study period (e). CsA cyclosporine A; MP-pulses methylprednisolone pulses

