Figure 1.
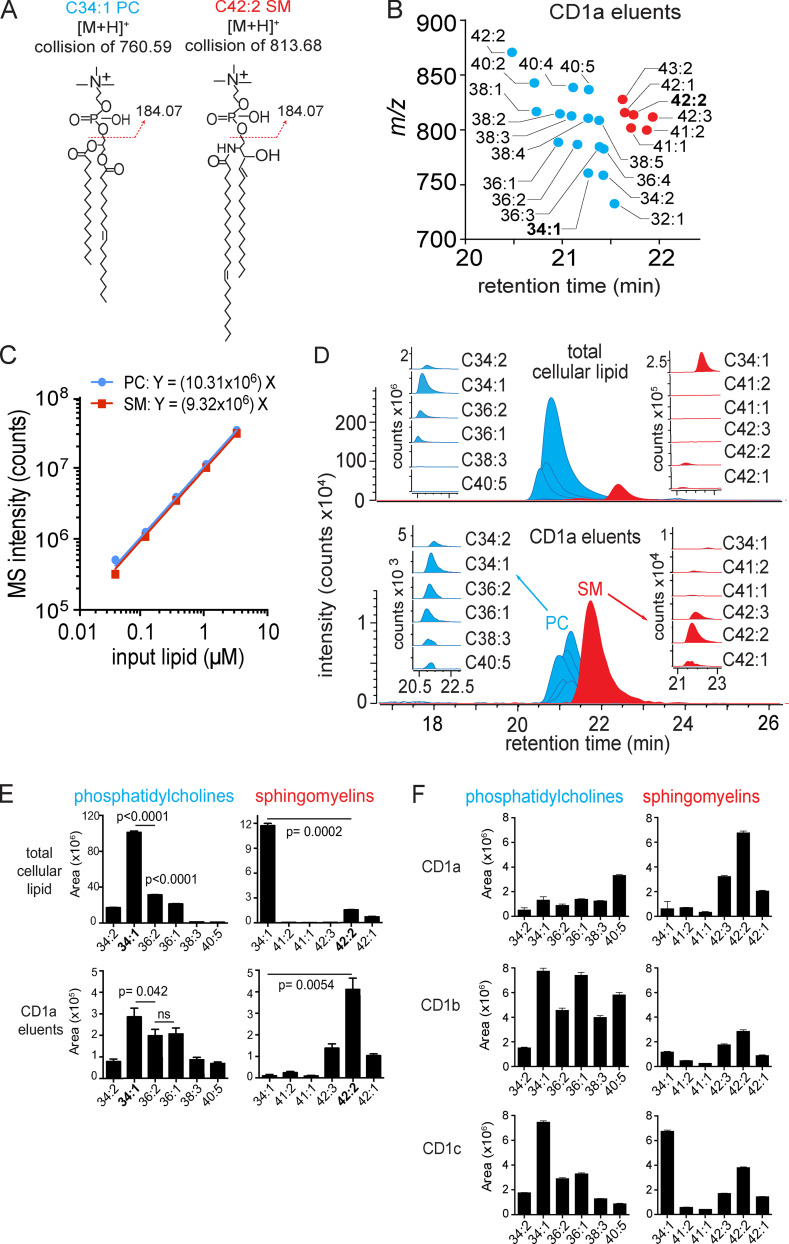
Targeted HPLC-MS analysis of CD1 monomer eluents and cellular lipids. (A) Collision-induced dissociation–MS analysis for CD1a ligands matching the expected m/z of 34:1 PC and 42:2 SM identified the phosphocholine groups, allowing assignment of the overall length and unsaturation states of the alkyl chains. The position and Z or E stereochemistry are inferred from known lipid structures but cannot be established by MS. (B) Chain length and saturation variants identified within the same lipid class have equivalent RTs that match those of SM and PC standards. The m/z values allowed deduction of the combined chain length of the acyl chain and sphingosine units that vary by an integer number of methylene units (X) or unsaturations (Y), shown as X:Y. We identified 16 molecular variants of PC (blue points) and six SMs (red points), which were seen in two datasets analyzed. (C) Response factors for SM and PC were highly similar and nearly linear based on MS intensity measured as a function of the mass input for two synthetic standards, 34:1 PC AND 42:2 SM. (D) Mass chromatograms of the six most abundant PC and SM family members eluted from the CD1a monomer (bottom) and in the total lipid extract from matched CD1a-producing HEK293T.TPM cells (top). (E) PCs and SMs quantified as integrated area under the curve (counts) for each lipid chain variant detected in triplicate (± SEM) at a diagnostic m/z value and RT window. P values were calculated using Welch’s corrected t test. (F) PCs and SMs, eluted from CD1a, CD1b, and CD1c protein monomers, quantified as integrated area under the curve for each lipid chain variant detected in triplicate at a diagnostic m/z value and RT window. Error bars indicate SD from the mean. For D and E, results are representative of three experiments, and for F, results are representative of more than three experiments with interexperimental replication shown in Fig. S1. [M+H]+, mass of the molecular ion plus a proton adduct.

