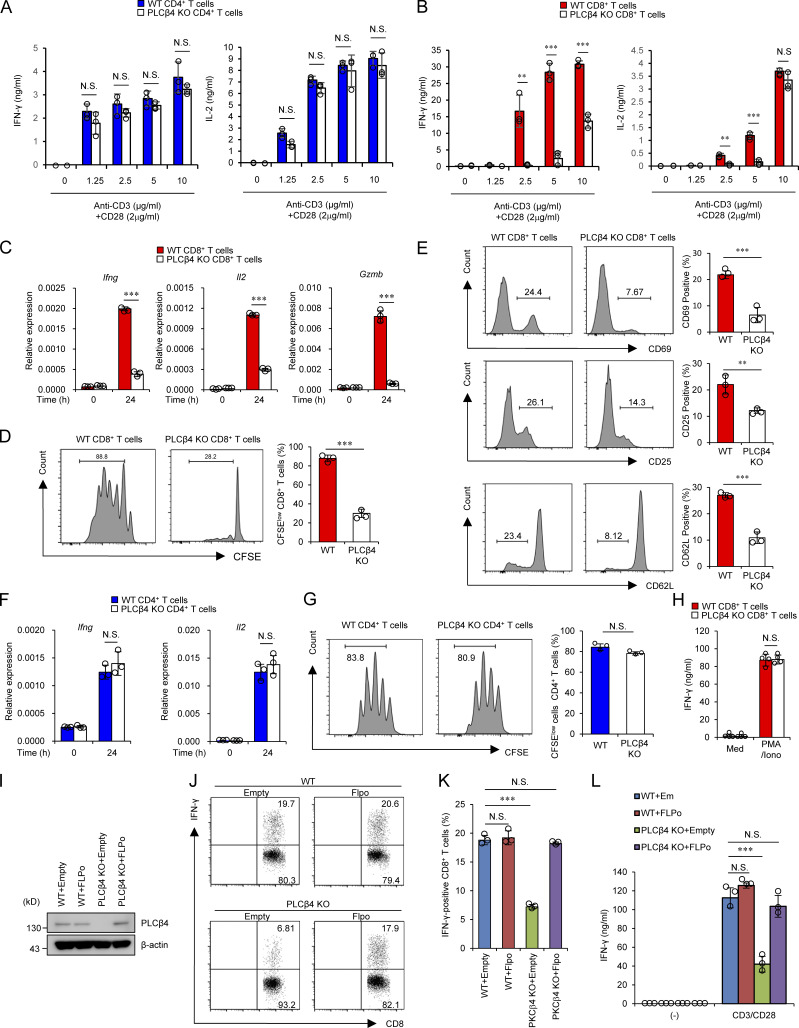
Figure 2.
PLCβ4 deficiency exhibits impaired activation of CD8+ T cells, but not CD4+ T cells. (A and B) Purified CD4+ T cells (A) and CD8+ T cells (B) from WT and PLCβ4-deficient mice were stimulated with indicated doses of anti-CD3 and anti-CD28 for 72 h. Concentrations of IFN-γ and IL-2 in the culture supernatants were measured by ELISA. (C) Quantitative PCR analysis of the levels of Ifng, Il2, and Gzmb mRNA in WT or PLCβ4-deficient CD8+ T cells unstimulated or stimulated with anti-CD3 (5 µg/ml) and anti-CD28 (2 µg/ml) for 24 h. (D) CFSE-labeled WT or PLCβ4-deficient CD8+ T cells were stimulated with anti-CD3 (5 µg/ml)/anti-CD28 (2 µg/ml) for 3 d. The fluorescence intensity of CFSE-labeled CD8+ T cells was analyzed by flow cytometry. (E) Flow cytometry analysis of CD69, CD25, and CD62L in WT or PLCβ4-deficient CD8+ T cells stimulated with anti-CD3 (5 µg/ml) and anti-CD28 (2 µg/ml) for 6 h. (F) Quantitative PCR analysis of the levels of Ifng and Il2 mRNA in WT or PLCβ4-deficient CD4+ T cells unstimulated or stimulated with anti-CD3 (5 µg/ml) and anti-CD28 (2 µg/ml) for 24 h. (G) CFSE-labeled WT or PLCβ4-deficient CD4+ T cells were stimulated with anti-CD3 (5 µg/ml)/anti-CD28 (2 µg/ml) for 3 d. The fluorescence intensity of CFSE-labeled CD4+ T cells was analyzed by flow cytometry. (H) Purified CD8+ T cells from WT and PLCβ4-deficient mice were stimulated with PMA (50 ng/ml) and ionophore (1 µg/ml) for 72 h. Concentrations of IFN-γ in the culture supernatants were measured by ELISA. Med, medium. (I–L) Purified CD8+ T cells from WT or PLCβ4-deficient mice were retrovirally transduced with empty or Flp recombinase. (I) PLCβ4 protein levels in the indicated lysates were determined by Western blotting. (J and K) Frequencies of IFN-γ producers were determined by flow cytometry after stimulation with anti-CD3 (0.5 µg) and anti-CD28 (1 µg/ml). (L) Transduced cells were stimulated with anti-CD3 (0.5 µg) and anti-CD28 (1 µg/ml) for 72 h. Concentrations of IFN-γ in the culture supernatants were measured by ELISA. Indicated values are means ± SD of three biological replicates (A–L). **, P < 0.01; ***, P < 0.001; N.S., nonsignificant. Data are representative two (I) or three (J) independent experiments.

