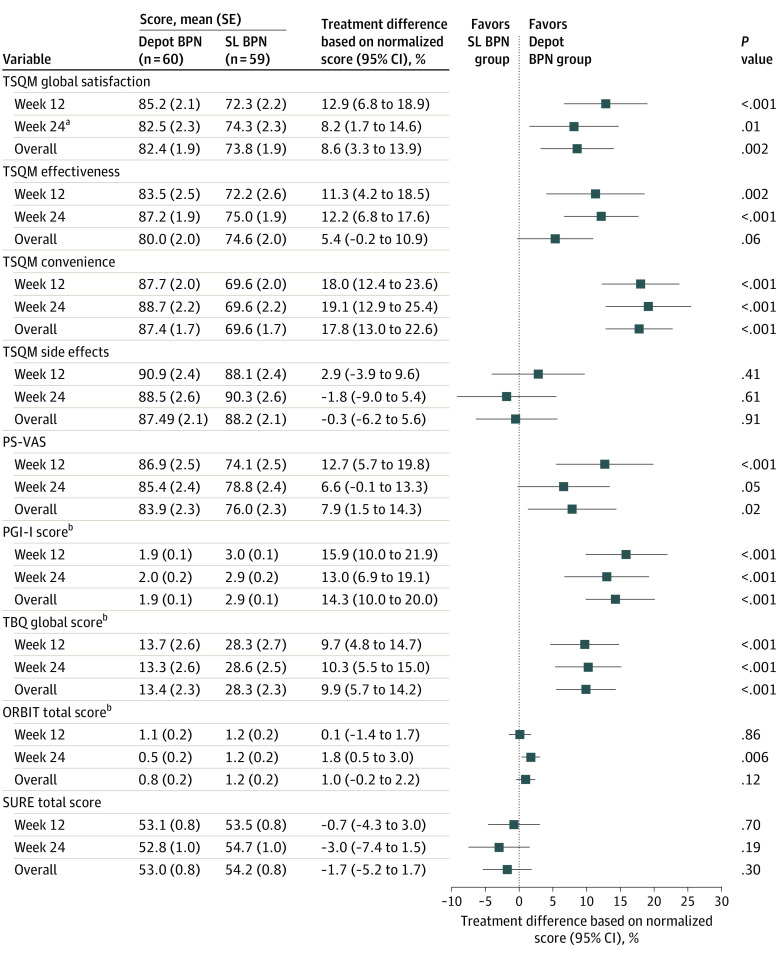
Figure 2. Overview of Treatment Satisfaction Questionnaire for Medication (TSQM), Patient Satisfaction–Visual Analog Scale (PS-VAS), Patient Global Impression of Improvement (PGI-I), Treatment Burden Questionnaire (TBQ), Opioid-Related Behaviors in Treatment (ORBIT), and Substance Use Recovery Evaluator (SURE) Results.
Summary of results from the mixed model for repeated measures, in which the 95% CIs in the forest plot have been normalized by the maximal possible score by instrument to give a range in percentages for ease of comparability. Analysis by week was performed by mixed model for repeated measures and overall by analysis of covariance.
aPrimary variable.
bThe 95% CIs in the forest plot graph were sign-reversed to achieve comparability.

