
Figure EV4. SVM confidence score versus test set precision.
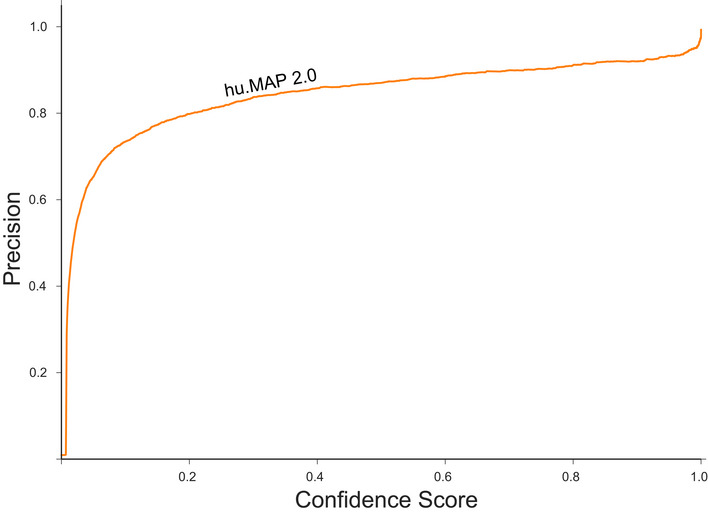
The line plot shows the relationship between the SVM confidence score, and the empirical precision value calculated from the test set of protein interactions. The relationship shows the precision value is consistently higher than the confidence score.